S&P 500: The Anatomy of an Impulse Reversal
 VLAD_KESSLER2 min read·2 hours ago
--
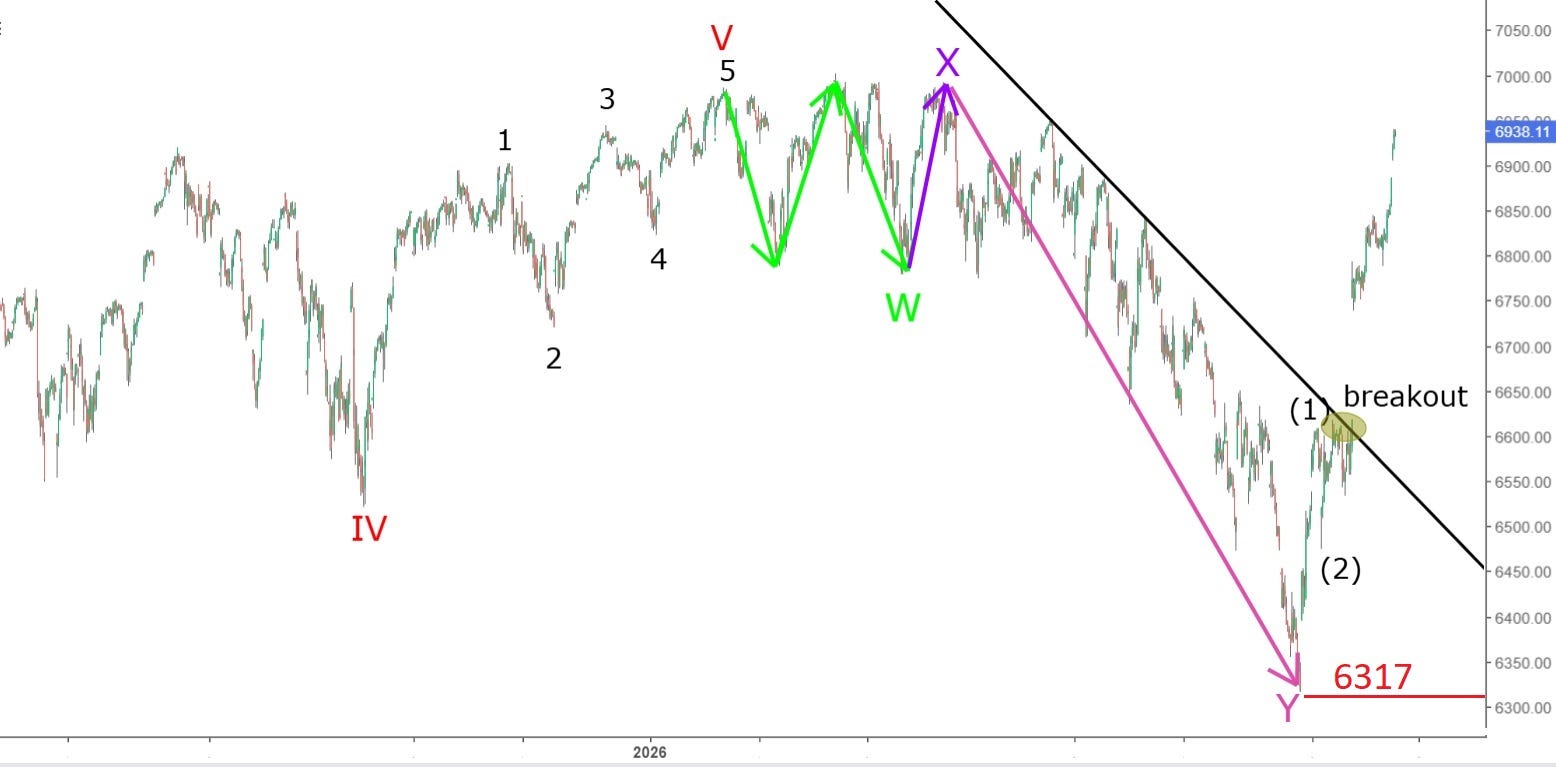
The S&P 500 is currently at a critical structural junction. Following the definitive bottom at 6,317, the market has transitioned from a corrective phase into a clear impulsive move.
Proven Results
My technical roadmap, shared earlier this month on LinkedIn, has already seen both primary targets successfully achieved. This validation confirms that the market structure is following a specific Elliott Wave pattern that most retail traders are currently overlooking.
The Elliott Wave Thesis
The reversal from the 6,317 low isn’t just a “dead cat bounce.” The internal characteristics of the current price action suggest we are in the 5th Wave extension.
There are two primary paths forward:
- The Dominant Bull Case: A continuation towards higher swing zones, provided key support levels remain intact.
- The Irregular Flat Scenario: A more complex ABC structure that could trap late buyers before the next major leg up.
Key Levels & Targets
While the general trend is bullish, the exact “swing zones” and the “line in the sand” for this move are critical for risk management. Identifying where the 5th wave ends and the next significant correction begins is the difference between profit and getting caught in a reversal.
💡 Full Analysis & Specific Targets
The detailed breakdown of exact price targets (7,100–7,400+ range), specific invalidation levels, and the attached technical charts are available exclusively for subscribers.
To access the full report and receive real-time updates on this structure, join the inner circle on Substack:
https://vlad1111.substack.com/p/s-and-p-500-current-market-structure
Thank you for reading!