LLMs are usually treated as big black boxes, and I don’t really like black boxes.
I think one of the nicest ways to approach black boxes in the software world is performance analysis.
So we’re going to run a few experiments.
The setup
We’ll use a small language model that we can run ourselves, without having to sell our house to do it.
The model is: https://huggingface.co/microsoft/Phi-3-mini-4k-instruct-gguf
This is Phi-3 Mini — a relatively small model with 3.8B parameters from Microsoft, using the 4k context-length variant.
We’ll use huggingface_hub to download the model and llama_cpp to run it.
https://medium.com/media/92abef2a3f22c68376e568127a8fdb87/hrefSo what the hell is actually happening here?
We import llama_cpp, a highly optimized library for running LLMs efficiently.
from huggingface_hub import hf_hub_download
We configure the model name and file, specifically selecting Phi-3 with FP16 weights.
FP16 indicates that each model weight is stored as a 16-bit value, preserving relatively high precision.
model_name = "microsoft/Phi-3-mini-4k-instruct-gguf"
model_file = "Phi-3-mini-4k-instruct-fp16.gguf"
model_path = hf_hub_download(model_name, filename=model_file)
Loading the model — this step initializes the engine and allocates memory.
llm = Llama(
    model_path=model_path,
    n_gpu_layers=-1,
    n_ctx=4096,
    verbose=True
)
- n_gpu_layers = -1 means all layers of the model are loaded directly into the GPU VRAM. In our case, that’s roughly 8 GB of model weights sitting right in VRAM, giving the GPU fast access to the model.
- n_ctx = 4096 reserves a fixed number of tokens for both input and output. This directly affects how much VRAM is needed to store the context.
- verbose=True lets us see detailed logs during both loading and execution.
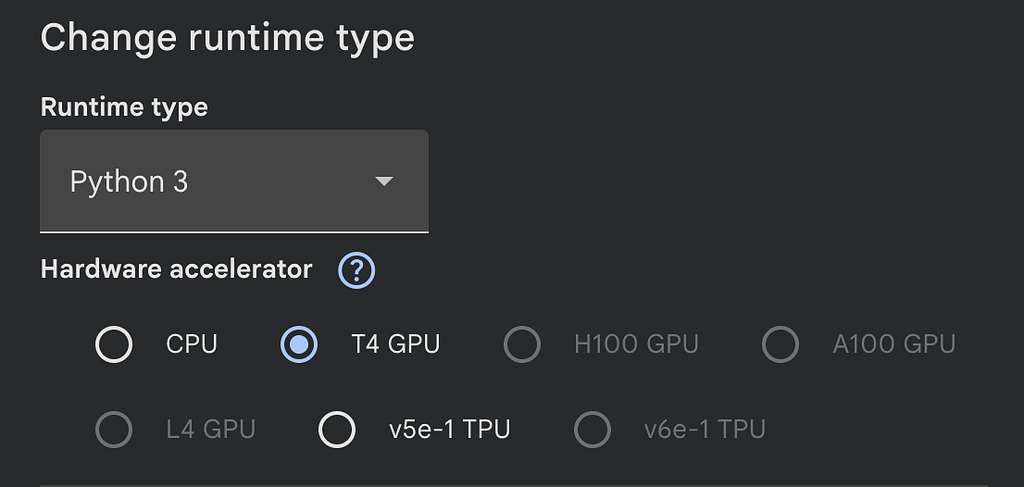
We’re using a Google Colab T4 GPU with 16 GB of VRAM, which means it can comfortably run this small model — and then some.
First experiment — discovery begins
Alright, great! We’ve got a model. Let’s run our very first, very naive performance check.
https://medium.com/media/3167c9a36b7222184d718d92268d300f/href- We create a prompt: “Write a story about a robot discovering a flower”, using the special tokens (<|user|>, <|end|>, etc.) that the Phi-3 model understands.
- We reset the LLM so we don’t hit the KV cache (we won’t go into that here). This ensures each run is independent from the previous one.
- Then, we print the result.
And there it is — our very first output, arriving into the world with all the wonder, awe, and nervous excitement of a firstborn child taking its first breath.
⏳ Generating response...

llama_perf_context_print:        load time =     677.17 ms
llama_perf_context_print: prompt eval time =      47.69 ms /    16 tokens (    2.98 ms per token,   335.51 tokens per second)
llama_perf_context_print:        eval time =    7571.24 ms /   199 runs   (   38.05 ms per token,    26.28 tokens per second)
llama_perf_context_print:       total time =    7730.32 ms /   215 tokens
llama_perf_context_print:    graphs reused =        192
============================================================
💬 PROMPT
------------------------------------------------------------
Write a short story about a robot discovering a flower.
============================================================
🤖 MODEL RESPONSE
------------------------------------------------------------
In a world where steel and silicon intertwined seamlessly, a
robot named Ada worked tirelessly on the sprawling
manufacturing plant. She was an assembly line marvel, her
metallic fingers moving with precision, never tiring nor
faltering. Ada's existence was a symphony of whirring gears
and soft electronic hums, her purpose clear: to create, to
build, to manufacture.

One day, while Ada was performing her usual tasks, something
unusual caught her sensors. An irregularity, a deviation
from the monotony of her routine. The anomaly appeared as an
irregular color in a corner of the factory floor. Ada's
curiosity was piqued. With an inquisitive gaze, she
approached the spot, her mechanical limbs gliding across the
cold concrete.

There, amidst the starkness of the industrial setting, lay
an object that did not belong—a delicate, v

============================================================

📊 Stats: 16 prompt + 200 completion = 216 total tokens
So first, we can see that we get a nice little story, which is cut off because we only allowed a maximum of 200 tokens in the output. We also see that we sent in 16 tokens and got 200 tokens back.
And on top of that, we get a neat breakdown:
- Load time (677.17 ms): The time it took to load the model weights into the GPU VRAM.
- Prompt eval time (47.69 ms): The time it took to process the 16 input tokens. This averages out to 2.98 ms per token.
- Eval time (7571.24 ms): The time it took to generate the output. It generated 199 tokens, which comes out to 38.05 ms per token.
- Total time: The wall-clock time it took for the entire inference (excluding the load time). Notice that it’s not perfectly equal to prompt eval time + eval time because there is some extra overhead not measured there.
With more runs, these results stay pretty consistent.
It is ~9 times faster per token to process the input prompt than it is to generate the response. Clearly, there is an interesting difference between these two stages. Let’s try to understand what that is.
Second Experiment — First discovery
I feel we’ve been a little unfair in our comparison — we gave the generation phase way more work to do than the prompt processing phase. Let’s see what happens when we have almost the exact same token count for both the prompt and the result.
https://medium.com/media/faa75521b2aea514cf1167cbe8e92e97/hrefThe results:
⏳ Generating response (long prompt)...

llama_perf_context_print:        load time =     677.17 ms
llama_perf_context_print: prompt eval time =     167.23 ms /   219 tokens (    0.76 ms per token,  1309.60 tokens per second)
llama_perf_context_print:        eval time =    8393.50 ms /   199 runs   (   42.18 ms per token,    23.71 tokens per second)
llama_perf_context_print:       total time =    8661.44 ms /   418 tokens
llama_perf_context_print:    graphs reused =        191
============================================================
💬 PROMPT
------------------------------------------------------------
Continue this story from where Marcus activates the android:
"The old factory had been silent for decades. Vines crept
through broken windows,  and wildflowers pushed through
cracks in the concrete floor. Marcus walked carefully
through the ruins, his boots crunching on fallen debris. He
had heard rumors of  something extraordinary hidden here—a
working android from before the collapse.  As he turned a
corner, he saw it: a humanoid figure covered in moss,
sitting  motionless against a rusted machine. Its eyes were
dark, lifeless. Marcus knelt  beside it, brushing away the
vegetation. The android's chest plate was cracked,  exposing
ancient circuitry. He reached for the emergency activation
switch.  With trembling fingers, Marcus pressed the button.
A soft hum began to emanate  from deep within the android's
chest."<|end|} <|assistant|>
============================================================
🤖 MODEL RESPONSE
------------------------------------------------------------
The hum grew louder, echoing off the decaying walls, as if
the very air was charged with anticipation. The android's
limbs twitched imperceptibly, and its head tilted in a
semblance of curiosity. Marcus watched, heart pounding, as
the first signs of life stirred within the mechanical giant.

The android's hands slowly extended, fingers curling into a
fist. It shifted its weight, a subtle movement that revealed
more than just a spark of consciousness. Marcus could feel
his breath hitch; he knew the moment he had been waiting for
had arrived.

"Are you... alive?" Marcus whispered, almost afraid that his
own voice would shatter the fragile reality before him.

 The android's eyes flickered, adjusting to the dim light. A
faint, electric pulse passed through its visual receptors,
and then, with a slow,

============================================================

📊 Stats: 219 prompt + 200 completion = 419 total tokens
And here is a run where we repeated it 10 times to verify that the results stay consistent:
============================================================
RUN 1/10
============================================================
llama_perf_context_print:        load time =     677.17 ms
llama_perf_context_print: prompt eval time =     158.92 ms /   219 tokens (    0.73 ms per token,  1378.05 tokens per second)
llama_perf_context_print:        eval time =    7783.39 ms /   199 runs   (   39.11 ms per token,    25.57 tokens per second)
llama_perf_context_print:       total time =    8049.01 ms /   418 tokens
llama_perf_context_print:    graphs reused =        191

============================================================
RUN 2/10
============================================================
llama_perf_context_print:        load time =     677.17 ms
llama_perf_context_print: prompt eval time =     138.42 ms /   219 tokens (    0.63 ms per token,  1582.16 tokens per second)
llama_perf_context_print:        eval time =    8302.73 ms /   199 runs   (   41.72 ms per token,    23.97 tokens per second)
llama_perf_context_print:       total time =    8537.77 ms /   418 tokens
llama_perf_context_print:    graphs reused =        191

============================================================
RUN 3/10
============================================================
llama_perf_context_print:        load time =     677.17 ms
llama_perf_context_print: prompt eval time =     131.53 ms /   219 tokens (    0.60 ms per token,  1665.03 tokens per second)
llama_perf_context_print:        eval time =    8684.13 ms /   199 runs   (   43.64 ms per token,    22.92 tokens per second)
llama_perf_context_print:       total time =    8918.51 ms /   418 tokens
llama_perf_context_print:    graphs reused =        191

============================================================
RUN 4/10
============================================================
llama_perf_context_print:        load time =     677.17 ms
llama_perf_context_print: prompt eval time =     140.58 ms /   219 tokens (    0.64 ms per token,  1557.84 tokens per second)
llama_perf_context_print:        eval time =    8397.24 ms /   199 runs   (   42.20 ms per token,    23.70 tokens per second)
llama_perf_context_print:       total time =    8647.09 ms /   418 tokens
llama_perf_context_print:    graphs reused =        191

============================================================
RUN 5/10
============================================================
llama_perf_context_print:        load time =     677.17 ms
llama_perf_context_print: prompt eval time =     132.00 ms /   219 tokens (    0.60 ms per token,  1659.13 tokens per second)
llama_perf_context_print:        eval time =    8034.94 ms /   199 runs   (   40.38 ms per token,    24.77 tokens per second)
llama_perf_context_print:       total time =    8274.53 ms /   418 tokens
llama_perf_context_print:    graphs reused =        191

============================================================
RUN 6/10
============================================================
llama_perf_context_print:        load time =     677.17 ms
llama_perf_context_print: prompt eval time =     128.27 ms /   219 tokens (    0.59 ms per token,  1707.34 tokens per second)
llama_perf_context_print:        eval time =    7937.02 ms /   199 runs   (   39.88 ms per token,    25.07 tokens per second)
llama_perf_context_print:       total time =    8161.99 ms /   418 tokens
llama_perf_context_print:    graphs reused =        191

============================================================
RUN 7/10
============================================================
llama_perf_context_print:        load time =     677.17 ms
llama_perf_context_print: prompt eval time =     125.21 ms /   219 tokens (    0.57 ms per token,  1749.09 tokens per second)
llama_perf_context_print:        eval time =    7803.06 ms /   199 runs   (   39.21 ms per token,    25.50 tokens per second)
llama_perf_context_print:       total time =    8033.79 ms /   418 tokens
llama_perf_context_print:    graphs reused =        191

============================================================
RUN 8/10
============================================================
llama_perf_context_print:        load time =     677.17 ms
llama_perf_context_print: prompt eval time =     126.37 ms /   219 tokens (    0.58 ms per token,  1732.95 tokens per second)
llama_perf_context_print:        eval time =    7745.47 ms /   199 runs   (   38.92 ms per token,    25.69 tokens per second)
llama_perf_context_print:       total time =    7983.83 ms /   418 tokens
llama_perf_context_print:    graphs reused =        191

============================================================
RUN 9/10
============================================================
llama_perf_context_print:        load time =     677.17 ms
llama_perf_context_print: prompt eval time =     124.11 ms /   219 tokens (    0.57 ms per token,  1764.54 tokens per second)
llama_perf_context_print:        eval time =    7829.04 ms /   199 runs   (   39.34 ms per token,    25.42 tokens per second)
llama_perf_context_print:       total time =    8051.22 ms /   418 tokens
llama_perf_context_print:    graphs reused =        191

============================================================
RUN 10/10
============================================================
llama_perf_context_print:        load time =     677.17 ms
llama_perf_context_print: prompt eval time =     122.77 ms /   219 tokens (    0.56 ms per token,  1783.77 tokens per second)
llama_perf_context_print:        eval time =    7881.30 ms /   199 runs   (   39.60 ms per token,    25.25 tokens per second)
llama_perf_context_print:       total time =    8106.29 ms /   418 tokens
llama_perf_context_print:    graphs reused =        191
Breaking down the numbers:
- Prompt eval time: ~120 ms for 219 tokens, which comes out to 0.55 ms per token.
- Eval time: Generating the 199 output tokens took about 7880 ms, bringing it to 40 ms per token.
It seems like processing the input prompt is way faster than generating new tokens, even when the workloads are roughly the same size. Also, notice that the time to process each input token dropped from 2.98 ms down to around 0.55 ms — that’s over 5x faster per token!
Awesome! It seems we’ve discovered a key characteristic of LLMs: processing the prompt is indeed fundamentally faster than generating the response. There is clearly some kind of parallelism at play that allows us to reduce the time-per-token for larger inputs.
So, we’ve tested similar input and output sizes. But what happens when we drastically increase the prompt size?
Experiment: “I want my prompts bigger!”
Let’s run another test where we try different prompt sizes and see how they affect the token generation time.
https://medium.com/media/3d5bce508192a597f891d77f6b88069f/hrefThis little snippet creates 10 prompts of increasing lengths. It’s pretty straightforward — it just duplicates the context. Since we’re only trying to measure speed here and not output quality, you’ll have to cut me some slack! To keep things fair, we still generate exactly 199 tokens each time, and no more.
And for the results… drumroll, please:
📊 Generation Summary Table:
-------------------------------------------------------
Input Tokens | Gen Time (s) |   Tokens/sec
-------------------------------------------------------
         111 |         7.05 |        28.25
         404 |         7.50 |        26.52
         796 |         7.88 |        25.25
        1196 |         8.50 |        23.40
        1592 |         9.19 |        21.66
        1986 |         9.46 |        21.04
        2383 |         9.30 |        21.41
        2780 |         9.30 |        21.40
        3173 |         9.59 |        20.75
        3567 |         9.93 |        20.04
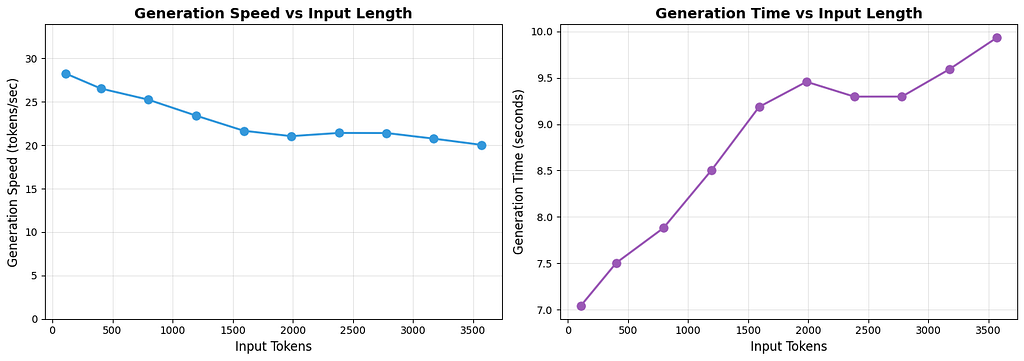
We can see a very clear trend here. Even though we aren’t generating more tokens, as we increase the number of input tokens, it takes longer to generate the output, meaning we generate fewer tokens per second. The takeaway is clear: larger input prompts increase the time it takes to generate a response of the exact same length.
But that is not the only data this measurement gave us. We can also see an interesting trend in the input processing time.
We have two more graphs:
- The time (in ms) to process each individual token versus the input token length.
- The total time to process the prompt versus the input token length.

📊 Prefill Summary Table:
--------------------------------------------------
  Tokens | Total (ms) |   ms/token
--------------------------------------------------
     111 |      89.30 |       0.80
     404 |     231.74 |       0.57
     796 |     467.91 |       0.59
    1196 |     740.67 |       0.62
    1592 |    1075.00 |       0.68
    1986 |    1406.53 |       0.71
    2383 |    1670.24 |       0.70
    2780 |    1992.06 |       0.72
    3173 |    2342.08 |       0.74
    3567 |    2689.80 |       0.75
The second graph is very straightforward: as we process more tokens, the total time to process them increases.
But the time per token is much more interesting. When the input length is low (like around 111 tokens), it seems we don’t fully utilize the GPU. However, right around 404 tokens, we hit a sweet spot of GPU utilization, after which the efficiency starts to drop again.
Let’s run another quick measurement in the lower ranges to see if this theory holds up:

For this test, we looked at a lower range of input tokens, from 50 up to 400. And sure enough, we see the exact same pattern: as we process a larger batch of input tokens, the time it takes to process each individual token decreases.
This is another clear indication that the GPU processes the input tokens in parallel.
We’ve played around a lot with the size of the input prompt — now it’s time to play with the size of the output.
Experiment 3: Generate more, please!
We will keep the input size minimal and change the amount we allow the LLM to generate with a little bit of trickery (poor LLM :/).
Here is our prompt:
https://medium.com/media/6565940fc75f9389a85a9b71271a2cac/hrefBasically, we are telling the model to keep generating forever. And here is our inference code, set up to force the model to generate a different number of tokens in each run:
https://medium.com/media/74609dbe43c28989795c79c72a38792d/hrefNotice that we did not provide the extra special tokens to make the LLM stop generating. This means it won’t automatically stop if the <|end|> token is generated, like it did before. We are forcing it to generate outputs of varying sizes, ranging from 50 to 1500 tokens.
Awesome!! Let’s see the results:
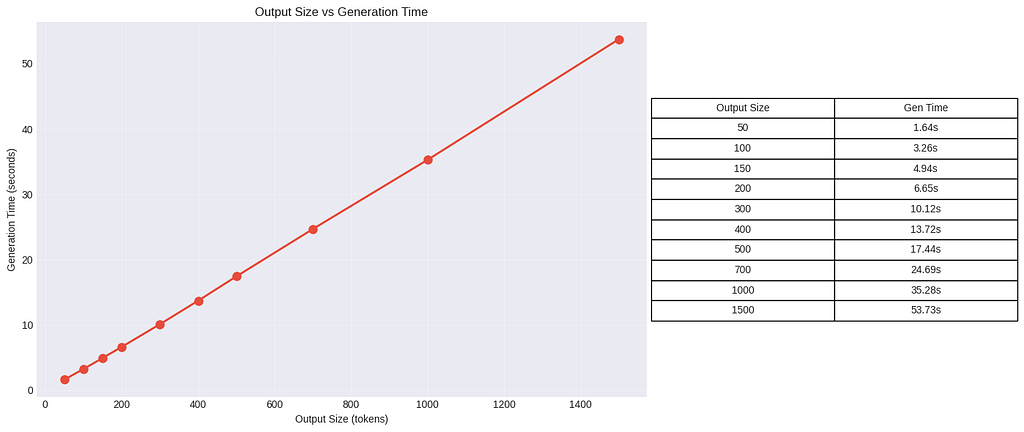
There are no real surprises here: as we increase the size of the output, we see a linear growth in the total time it takes to generate the whole sequence.
But let’s look at another, more interesting result — the output size versus the time it takes to generate each individual token.

We see kind of the same trend here. As we increase the output size, it takes slightly more time for the model to generate a single token.
But the increase is much more moderate. The time-per-token grows from 32.91 ms to 35.84 ms, which is an increase of about ~8.9%. This is a tiny drop in performance compared to the massive 3,174% increase in total generation time when scaling from 50 to 1500 tokens.
This teaches us that the model spends almost the exact same amount of time generating each token, with only a small degradation in speed as the output context increases (likely due to the growing KV cache needing to be updated and accessed).
However, we also see an odd result: it actually took more time per token when the output size was 50 than when it was 100.
To figure out if this is just a fluke, we’ll set up another experiment where we run the model for both sizes 10 times.
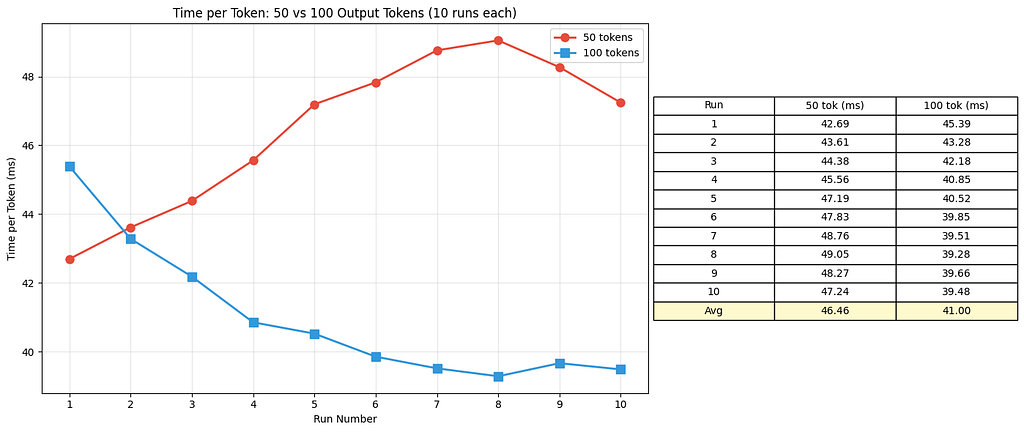
We see some very odd patterns in our initial 10-run test: for 50 tokens, we start out the fastest but slow down over time, while for 100 tokens, we start out the slowest but stabilize over time.
So, let’s try running them for longer — say, 20 runs:

It seems they both converge around 40 to 42 ms. This indicates that the time difference to generate a token between these two groups is actually insignificant. The initial variance we saw is likely affected by the many things happening behind the scenes that we aren’t exposed to here (like brief GPU warm-up states or background OS noise).
It’s a great reminder: a single measurement can often be very misleading!
The last thing we should look at is how the output length affects the prefill time.

We can see that, in contrast to the generation time (which shows a linear growth with respect to the output size), the prefill time stays constant. Even though we crank up the output size, the time it takes to process the prompt doesn’t really change, as long as the input size stays the same.
Another interesting observation: even though the generation time is affected by the size of the input prompt (as we saw in Experiment 2), the prefill time is not affected by the size of the output.
The ultimate takeaway here: Prefill time is almost entirely independent of the output size.
Summing Up
I hope you had as much fun as I did peeking a little bit into the LLM black box. We definitely found some interesting things — namely, that LLM inference is composed of two very distinct stages:
- The prefill phase (the fast beast): This is where the model processes the input prompt. The GPU processes all these tokens in parallel, which gives it a massive speed advantage over its slower brother. And as we proved, the output size does not affect it.
- The decode phase (the slow brother): This is where the model generates the response, one token at a time. Because it is sequential, we saw linear time growth as the output size increased.
We also learned that there is a “tax” for long contexts. A massive input prompt increases the total prefill time, and as the output context grows, the time it takes to generate each individual token increases slightly as well.
LLMs are complex beasts, but by running these performance checks, we now have a much better idea of how they work under the hood. Understanding these mechanics means we can optimize and use them better for our own needs.
Under the Hood: How LLMs Spend Their Time was originally published in Level Up Coding on Medium, where people are continuing the conversation by highlighting and responding to this story.