

 Written by Rakesh Upadhyay, Staff Writer. Reviewed by Allen Scott, Staff Editor. Written by Rakesh Upadhyay, Staff Writer. Reviewed by Allen Scott, Staff Editor.
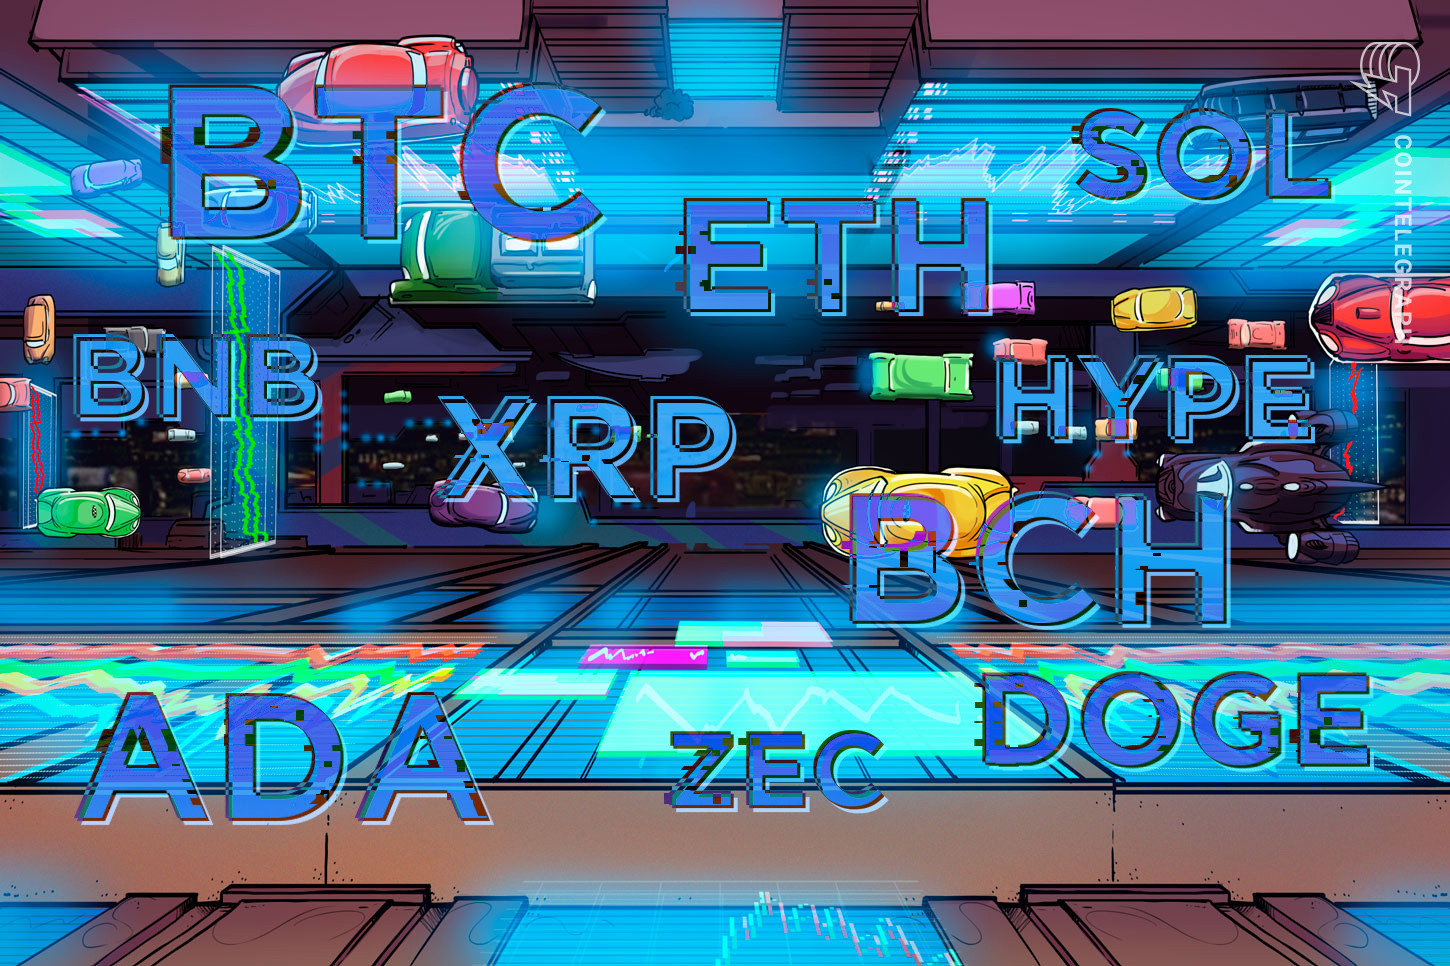
 Price predictions 5/15: BTC, ETH, BNB, XRP, SOL, DOGE, HYPE, ADA, ZEC, BCH
MarketsPublishedMay 15, 2026Sellers have pulled Bitcoin back below the $79,000 level, but buying may emerge as the price nears the $76,000 support.
Key points:
- Bitcoin is struggling to reach the $84,000 level, but a minor positive is that the bulls have not allowed the price to skid to the $76,000 support.
- Select major altcoins have turned down from their overhead resistance levels, indicating that the bears remain in control.
Bitcoin’s (BTC) recovery above $82,000 on Thursday was short-lived, as bears sold at higher levels and pulled the price back to the $79,000 level. Glassnode said in its Week On-chain report that several investors bought BTC between November 2025 and February near the $86,900 level. These holders may sell near their entry price after experiencing large drawdowns, creating a barrier for BTC’s continued rally.
Another negative view came from crypto analytics firm CryptoQuant, which said in a recent report that BTC has hit its major resistance at the 200-day moving average near $82,400. In 2022, BTC had resumed its downtrend after failing to cross above the 200-day SMA. BTC may get into trouble if history repeats itself.
In a bear phase, it is not uncommon for the price to hit a wall at the major resistance and pull back. However, a positive sign in favor of the bulls is that they have not allowed the price to dip back below the short-term breakout level of $76,000. That suggests the bulls are not hurrying to close their positions as they anticipate another leg higher.
Could BTC and the major altcoins hold on to their support levels? Let’s analyze the charts of the top 10 cryptocurrencies to find out.
Bitcoin price prediction
BTC rebounded off the 20-day exponential moving average ($79,251) on Thursday, but the bears sold the relief rally.
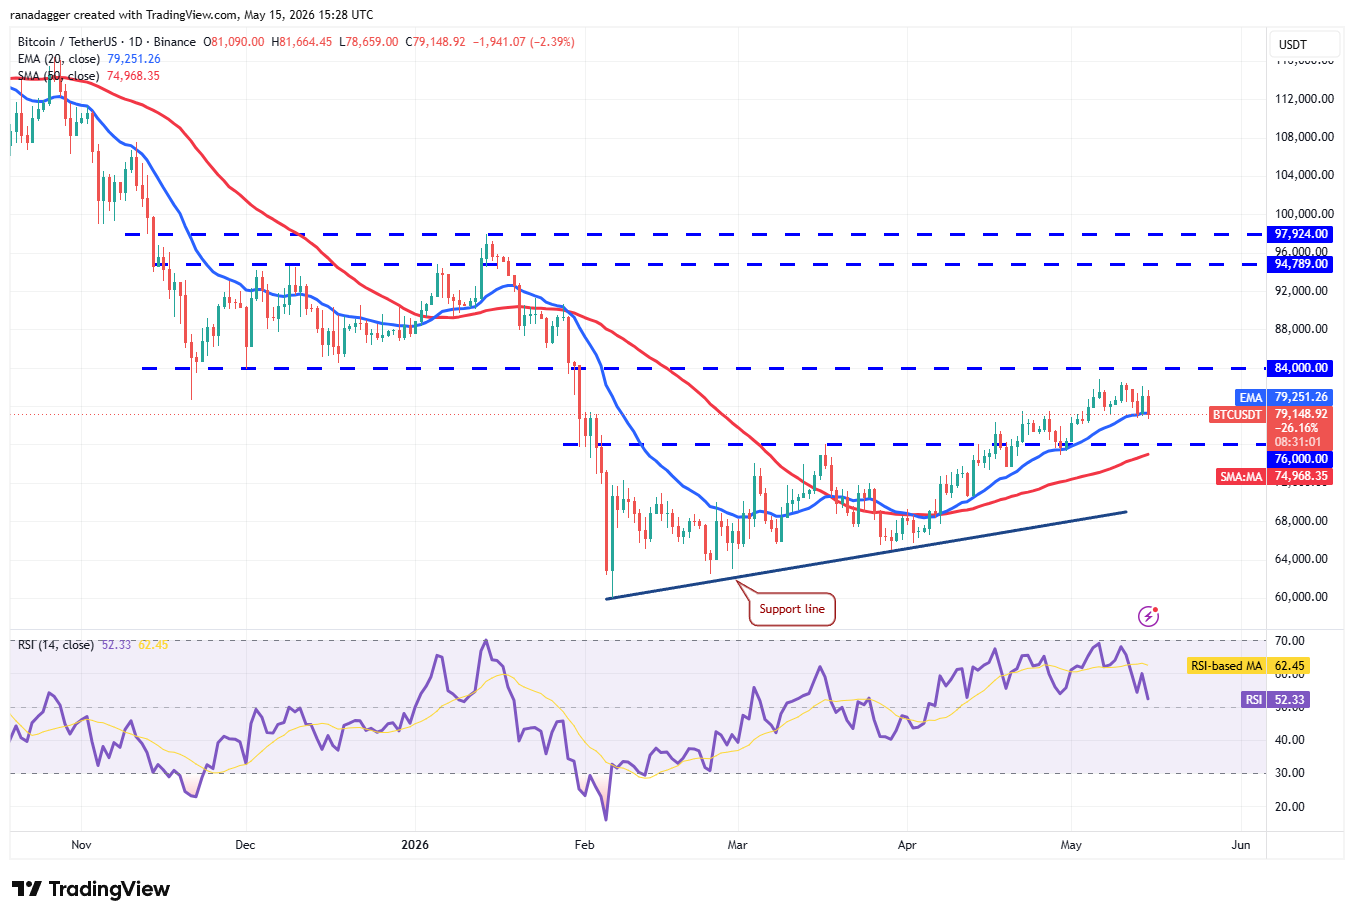
BTC/USDT daily chart. Source: Cointelegraph/TradingView
The BTC price has dipped back to the 20-day EMA, which is a crucial level for the bulls to defend if they want to retain the advantage. If the price turns up from the 20-day EMA with force, the bulls will again strive to push the BTC/USDT pair to $84,000. A break and close above $84,000 clears the path for a rally to $92,000.
On the contrary, if the price sustains below the 20-day EMA, it suggests that the bears are attempting a comeback. The pair may then tumble to the 50-day SMA ($74,968), which is again likely to attract buying by the bulls.
Ether price prediction
Ether (ETH) turned down from the 20-day EMA ($2,297) and has broken below the 50-day SMA ($2,250), indicating an advantage to sellers.
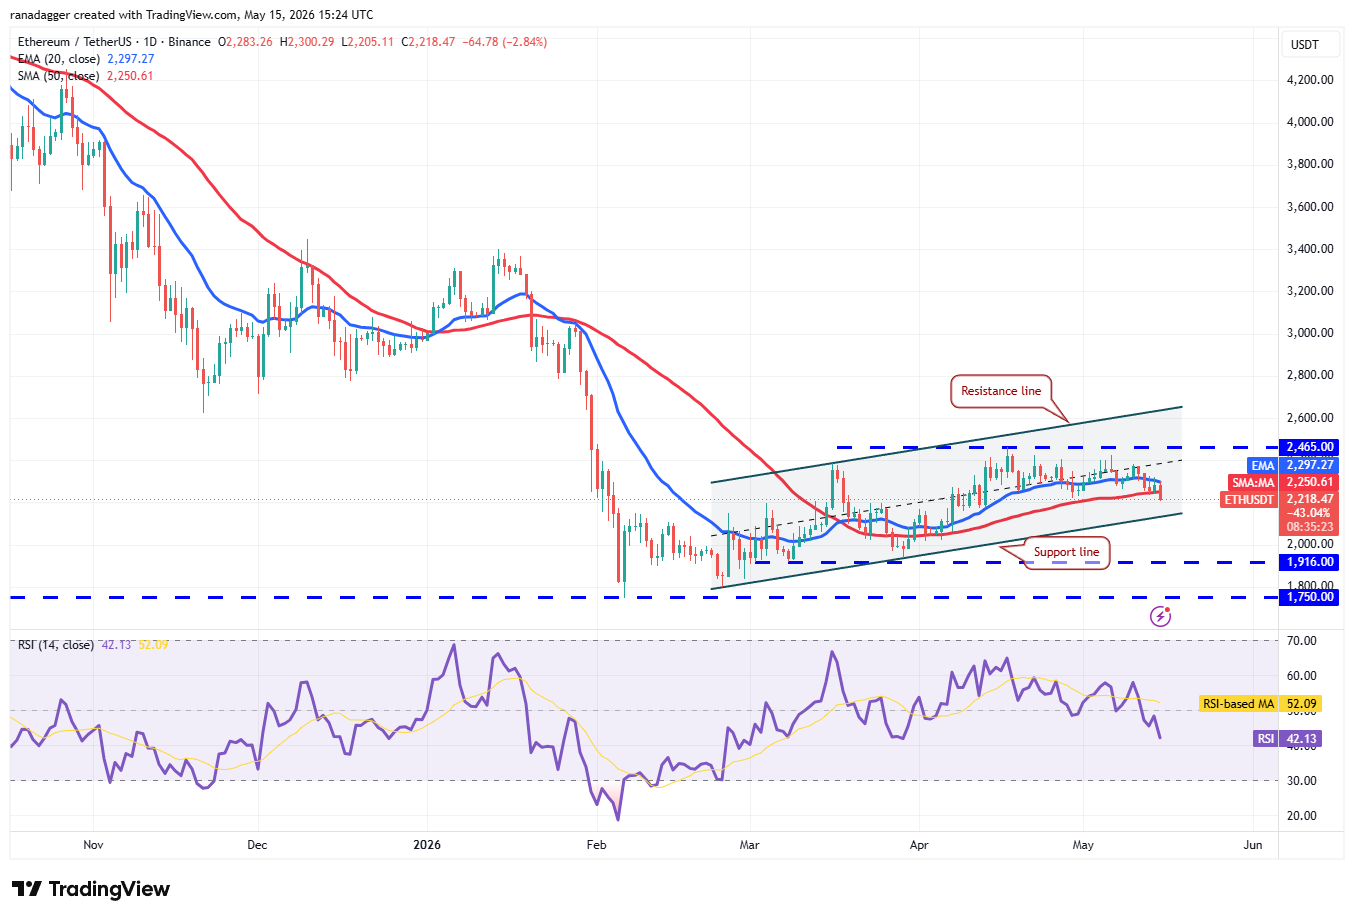
ETH/USDT daily chart. Source: Cointelegraph/TradingView
The ETH/USDT pair may plunge to the support line of the ascending channel pattern, which is a crucial level for the bulls to defend. The failure to do so may sink the ETH price to $1,916.
Instead, if the price turns up from the support line and breaks above the 20-day EMA, it signals buying at lower levels. The pair may then climb to $2,465, which is expected to behave as solid resistance. If buyers overcome the barrier, the pair may rally to the resistance line.
BNB price prediction
Sellers have successfully defended the $687 level in BNB (BNB), but the bulls continue to exert pressure.
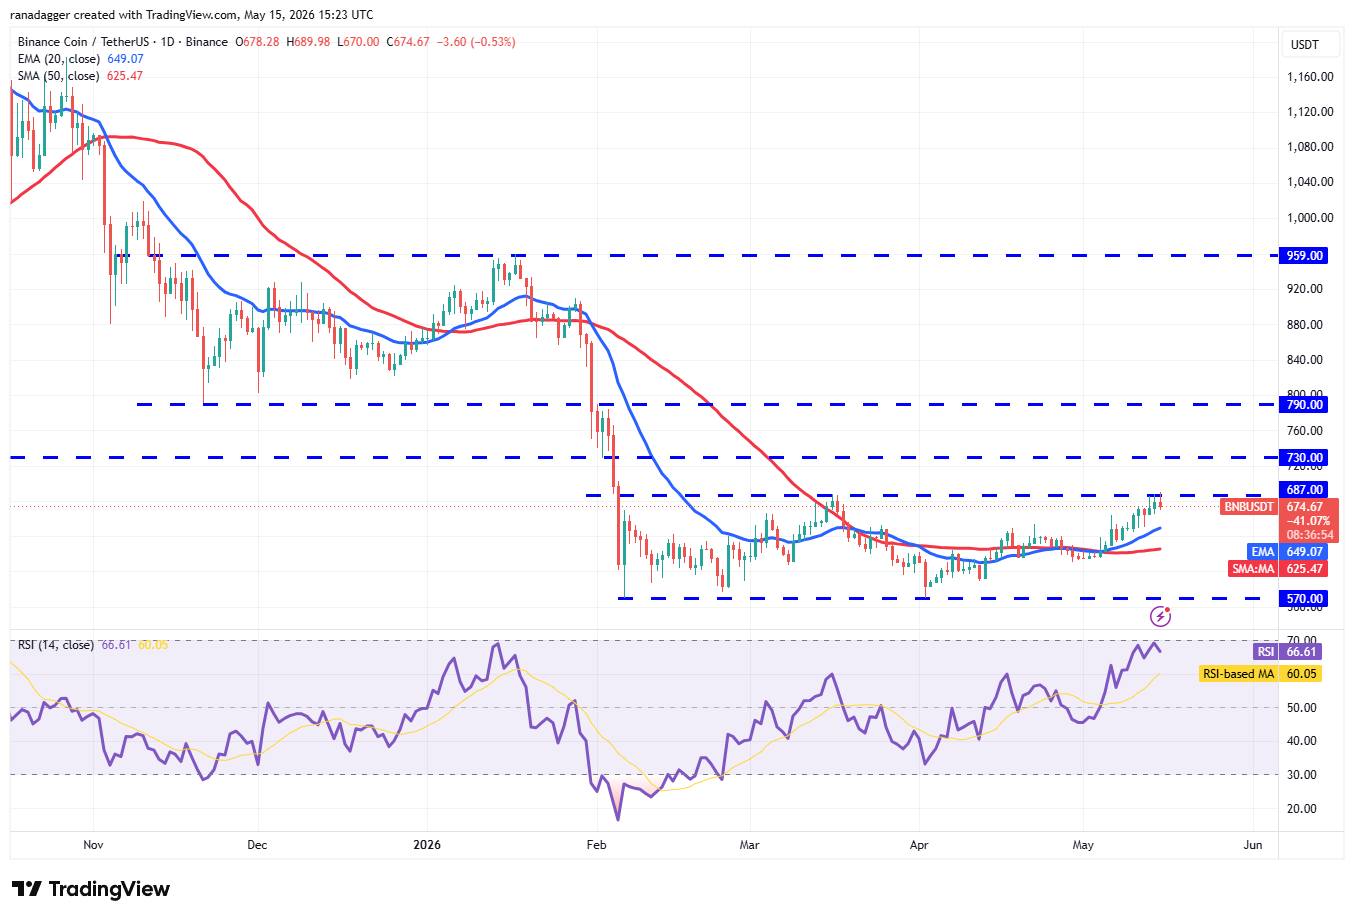
BNB/USDT daily chart. Source: Cointelegraph/TradingView
The upsloping 20-day EMA ($649) and the RSI near the overbought zone signal that the path of least resistance is to the upside. If buyers clear the $687 hurdle, the BNB/USDT pair may soar to $730 and later to $790.
This bullish view will be invalidated in the short term if the BNB price turns down sharply from the current level and breaks below the 20-day EMA. That suggests the pair may remain inside the $687 to $570 range for some more time.
XRP price prediction
XRP (XRP) rose from the 20-day EMA ($1.42) on Thursday and broke above the downtrend line of the descending channel pattern.
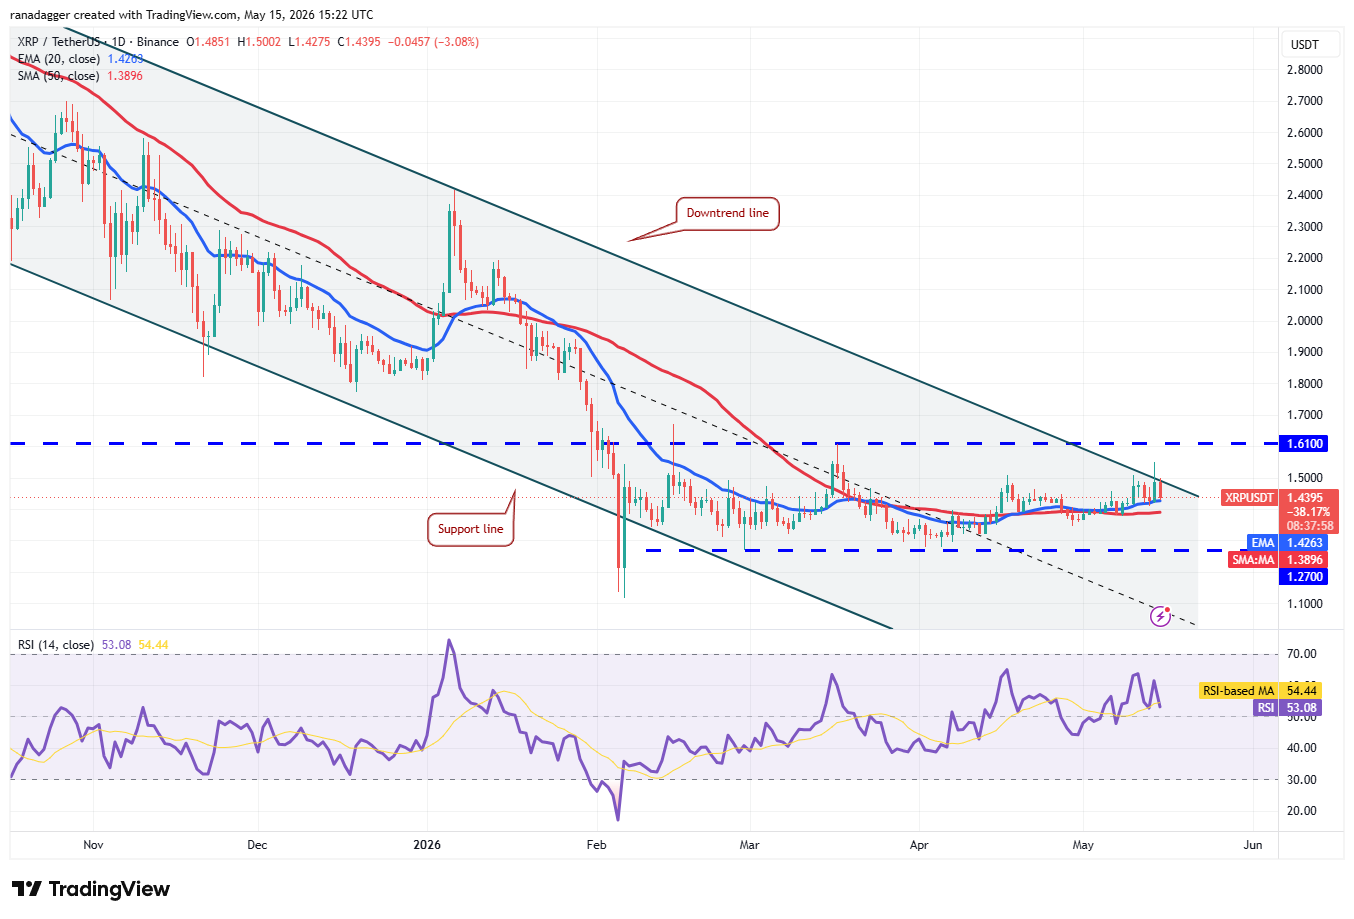
XRP/USDT daily chart. Source: Cointelegraph/TradingView
However, the bulls failed to achieve a close above the downtrend line, indicating that the bears are fiercely defending the level. Sellers will attempt to trap the aggressive bulls by pulling the XRP price below the moving averages. If they can pull it off, the XRP/USDT pair may plummet to $1.27.
Buyers are likely to have other plans. They will attempt to quickly push the price back above the downtrend line. If they do that, the likelihood of a break above the $1.61 resistance increases. The pair may then start a new up move to $2.
Solana price prediction
Solana (SOL) bounced off the 20-day EMA ($89) on Thursday, but the bears sold at higher levels.
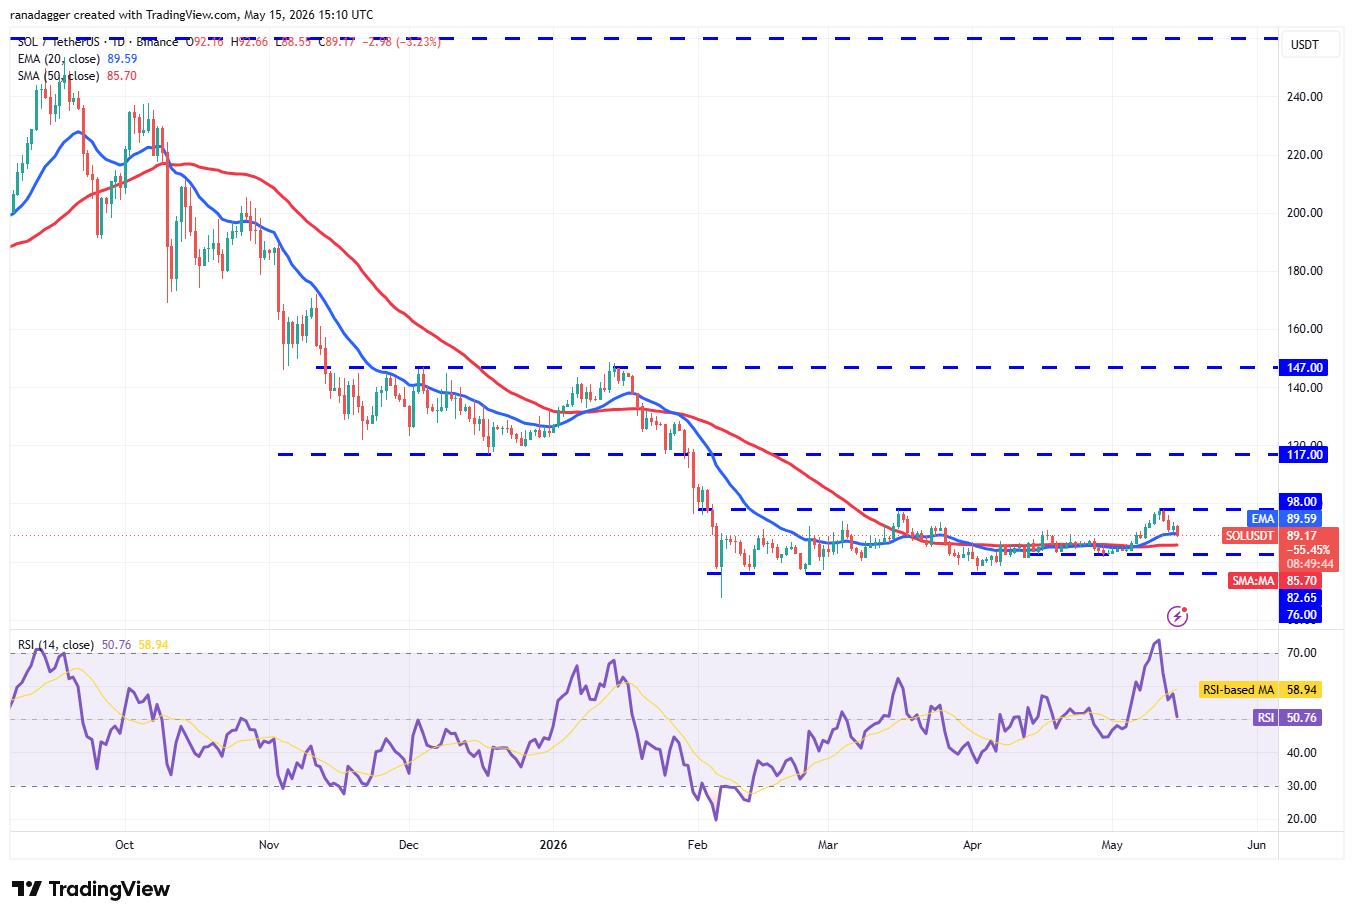
SOL/USDT daily chart. Source: Cointelegraph/TradingView
The SOL price has turned down and broken below the 20-day EMA. If the price maintains below the 20-day EMA, the SOL/USDT pair may continue to oscillate between $76 and $98 for a few more days.
Buyers will have to swiftly push the price back above the 20-day EMA to signal strength. The pair may then reach the $98 level, which is the critical overhead resistance to watch out for. A close above $98 clears the path for a rally to $106 and subsequently to $117.
Dogecoin price prediction
Dogecoin (DOGE) reached the $0.12 level on Thursday, where the bears are posing a stiff challenge to the bulls.
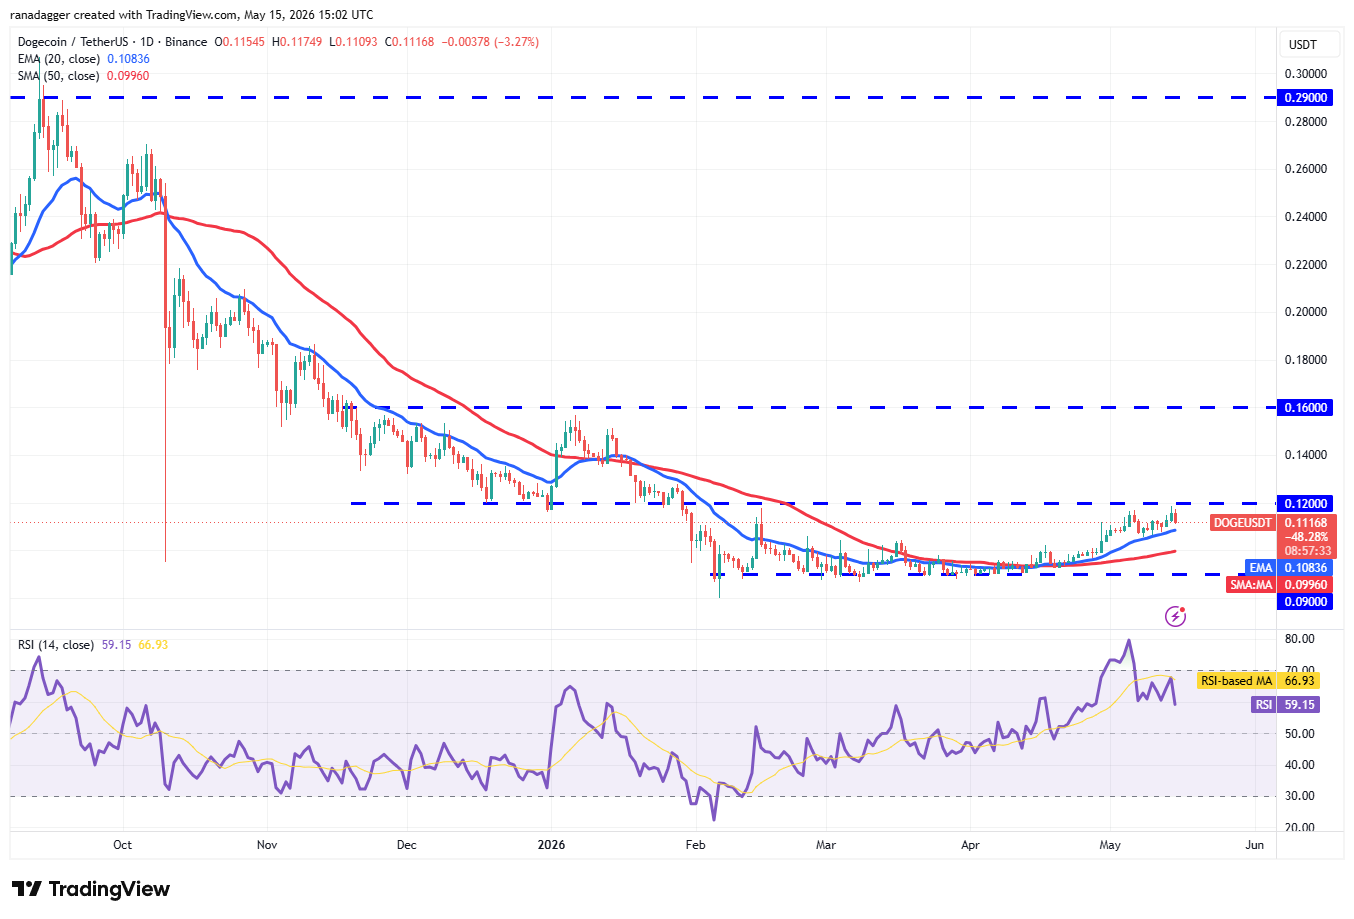
DOGE/USDT daily chart. Source: Cointelegraph/TradingView
If the DOGE price continues lower and breaks below the 20-day EMA ($0.11), it suggests that the traders are booking profits. That may keep the pair stuck between $0.09 and $0.12 for a while longer.
On the other hand, a solid bounce off the 20-day EMA signals that the bulls remain in control. That improves the prospects of an upside breakout. If that happens, the DOGE/USDT pair may surge to $0.14 and later to $0.16.
Hyperliquid price prediction
Hyperliquid (HYPE) made a solid comeback from the $38 level on Thursday, indicating aggressive buying at lower levels.
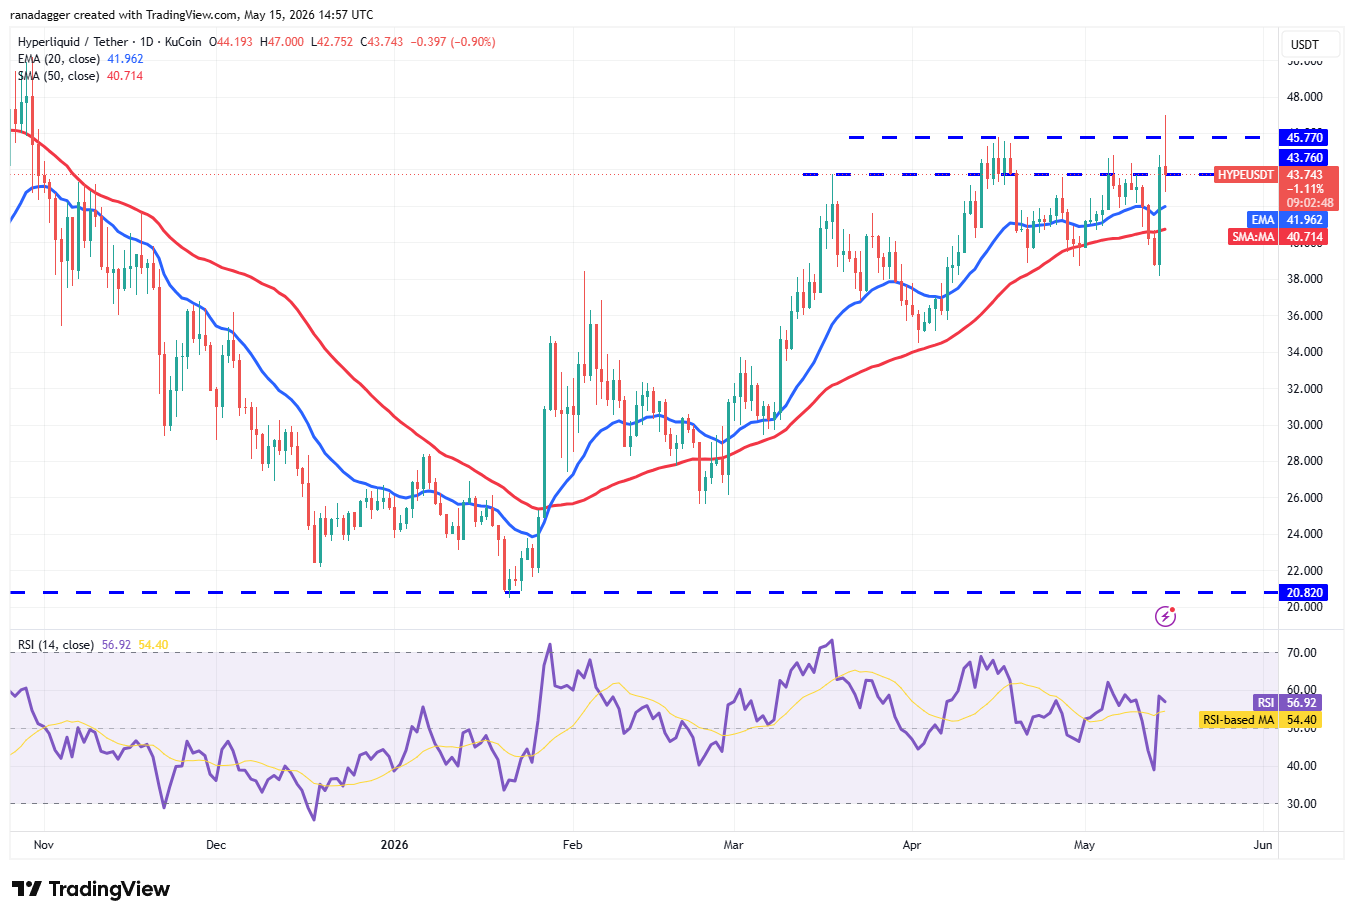
HYPE/USDT daily chart. Source: Cointelegraph/TradingView
The bulls continued their run on Friday and pushed the HYPE price above the $45.77 resistance. However, the long wick on the candlestick shows selling at higher levels. The bears will have to pull the price below the 20-day EMA ($41.96) to weaken the bullish momentum. The HYPE/USDT pair may then form a range between $38 and $47.
Contrary to this assumption, if the price turns up from the current level or the 20-day EMA and breaks above $47, it signals the resumption of the up move. The pair may then skyrocket toward the $50 to $51.43 zone.
Related: Bitcoin stalls above $80K despite CLARITY Act pass: What will trigger a breakout?
Cardano price prediction
Cardano (ADA) bounced off the 20-day EMA ($0.26) on Thursday, but the bulls could not sustain the higher levels.
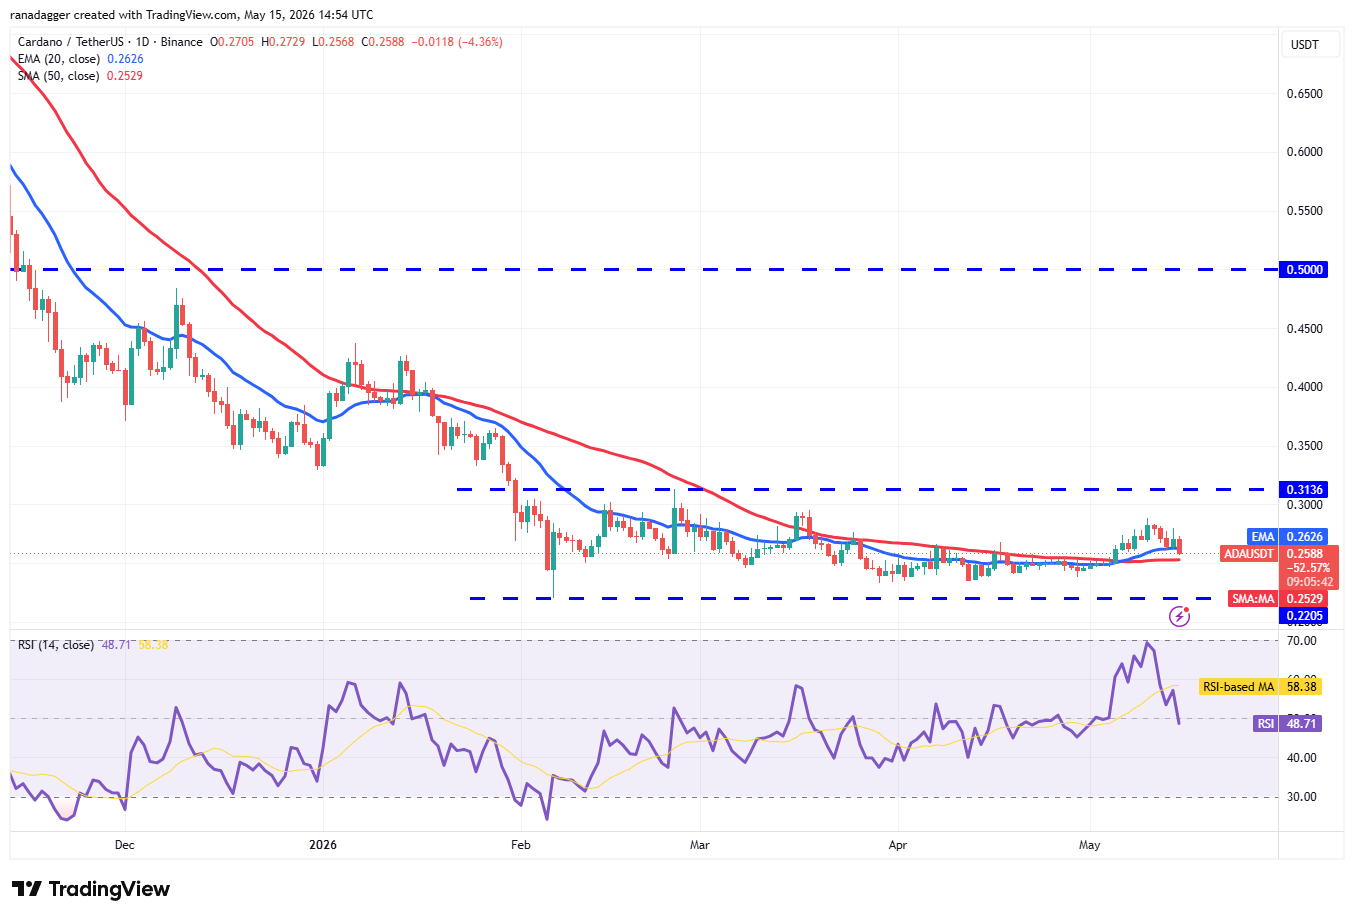
ADA/USDT daily chart. Source: Cointelegraph/TradingView
Sellers are attempting to strengthen their position by pulling the ADA price below the moving averages. If they manage to do that, the ADA/USDT pair may extend its stay inside the $0.22 to $0.31 range for some more time.
On the other hand, if the price turns up from the moving averages and breaks above $0.29, it suggests an advantage to buyers. The pair may then rise to $0.31, which is likely to attract sellers.
Zcash price prediction
Zcash (ZEC) turned up from the 38.2% Fibonacci retracement level of $518 on Thursday, but the bulls could not clear the $560 hurdle.
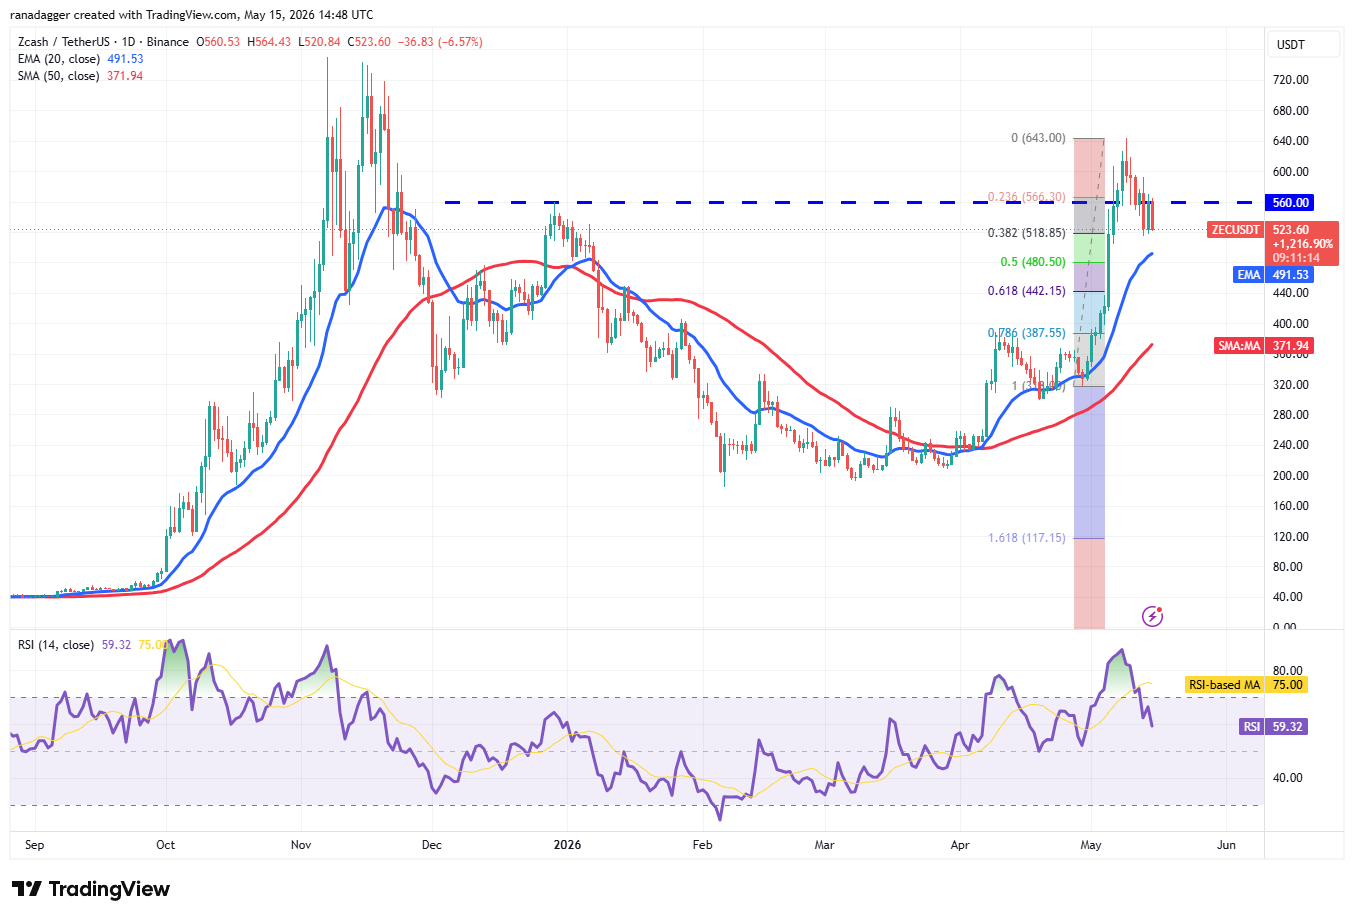
ZEC/USDT daily chart. Source: Cointelegraph/TradingView
The bears are attempting to pull the ZEC price below the $518 level and deepen the pullback to the 20-day EMA ($491). Buyers are expected to vigorously defend the 20-day EMA, as a close below it may sink the ZEC/USDT pair to the 61.8% retracement level of $442.
Contrarily, if the price rebounds off the 20-day EMA with force, it indicates a positive sentiment. The bulls will then attempt to drive the pair to $560 and eventually to $643.
Bitcoin Cash price prediction
Bitcoin Cash (BCH) has been trading inside the $419 to $486 range, signaling buying near the support and selling close to the resistance.
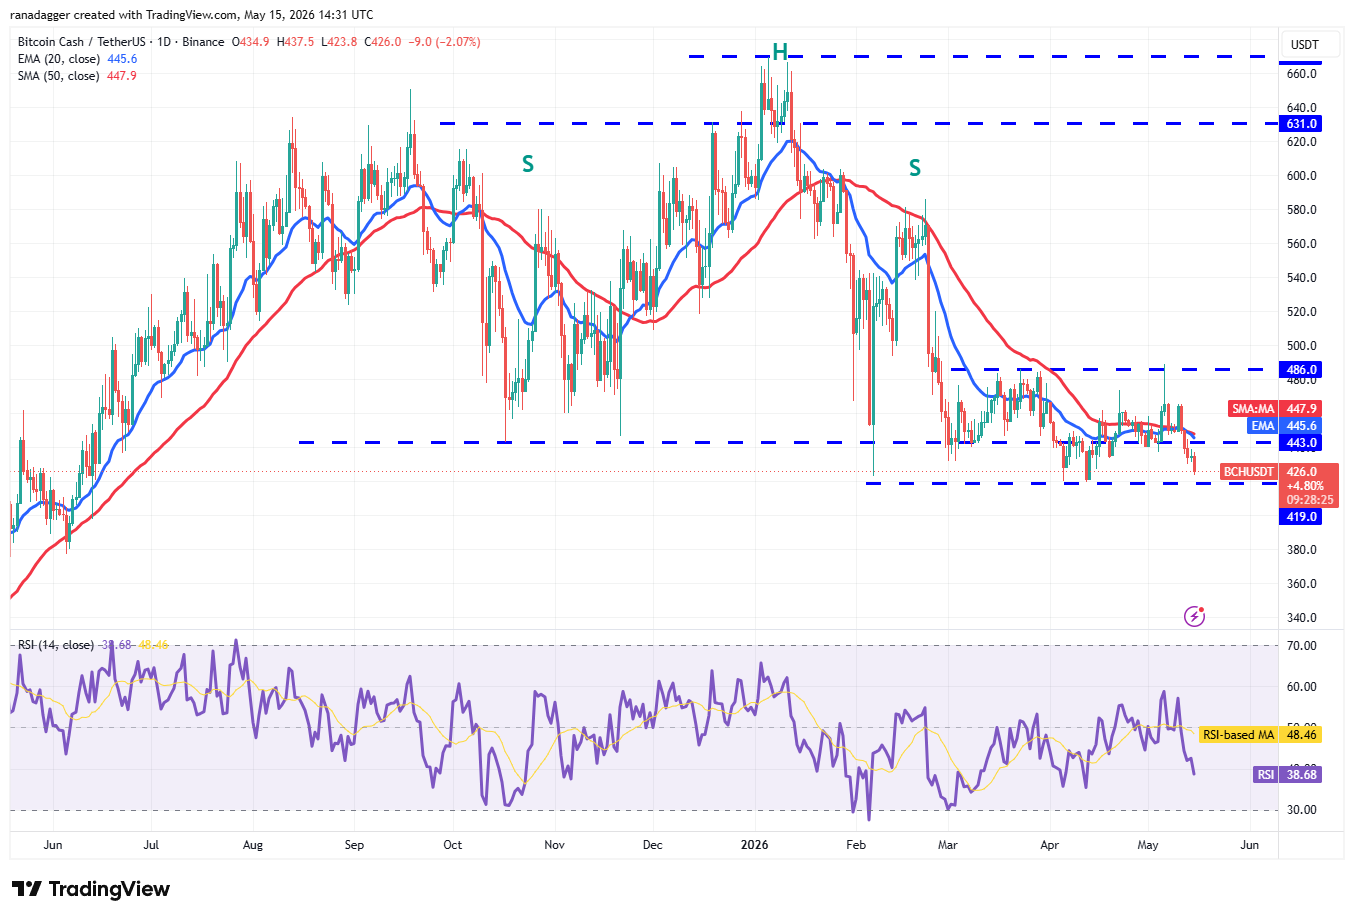
BCH/USDT daily chart. Source: Cointelegraph/TradingView
The moving averages have started to turn down, and the RSI is in the negative territory, indicating that the bears have the upper hand. Sellers will attempt to strengthen their position by pulling the BCH price below the $419 support. If they succeed, the BCH/USDT pair may resume the downtrend toward $375.
Buyers are likely to have other plans. They will attempt to defend the $419 level and push the price back above the moving averages. If they do that, the pair may remain inside the range for a few more days.
This article is produced in accordance with Cointelegraph's Editorial Policy and is intended for informational purposes only. It does not constitute investment advice or recommendations. All investments and trades carry risk; readers are encouraged to conduct independent research.- Cryptocurrencies
- Cryptocurrency Exchange
- Markets
- Market Analysis
- Price Analysis
- Bitcoin Price
- Ether Price
- BNB
- XRP
- Solana
- Dogecoin
- Cardano
- Zcash
- Bitcoin
More on the subject
 Bitcoin price dives under $79K as US bond market triggers 3% BTC price rout4 hours agoWilliam Suberg
 Bitcoin stalls above $80K despite CLARITY Act pass: What will trigger a breakout?7 hours agoNancy Lubale
 Bitcoin risks ‘next downtrend’ as traders diverge on fate of $82K resistance8 hours agoWilliam SubergBitcoin price dives under $79K as US bond market triggers 3% BTC price rout4 hours agoWilliam SubergBitcoin stalls above $80K despite CLARITY Act pass: What will trigger a breakout?7 hours agoNancy LubaleBitcoin risks ‘next downtrend’ as traders diverge on fate of $82K resistance8 hours agoWilliam Suberg