
Mohammad Bagher Ghalibaf, the speaker of Iran’s parliament, posted a striking piece of market commentary on X before the latest futures swing. Adding fuel to the online propaganda proxy war being fought on social media, the comments lean into accusations of insider trading on Polymarket war bets.
“Pre-market so-called ‘news’ or ‘Truth’ is often just a setup for profit-taking,” he wrote. “If they pump it, short it. If they dump it, go long.”
The market then traded almost exactly as described.
The Kobeissi Letter tracked the move in time order, with S&P 500 futures opening sharply lower on Sunday evening, recovering by late evening, then extending higher after President Trump said on Truth Social that “great progress” had been made on Iran peace talks.

MarketWatch confirmed the validity of the account that had so publicly offered contrarian trading advice to U.S. investors shortly before the Sunday futures open, and Barron’s described Monday’s rebound as another early-morning market jolt driven by Trump’s social-media messaging on Iran.
Trump’s posts around Iran have repeatedly altered short-term pricing across equities, oil, and crypto.
A week earlier, markets surged after Trump said a resolution with Iran was near.
 Related Reading
Bitcoin price confirms recovery hitting highest price since start of Iran war and Trump tariff chaos
Bitcoin is climbing while war and oil disruption make everything else harder to price.
Mar 16, 2026 · Liam 'Akiba' WrightBloomberg reported that billions of dollars in oil and stock-index futures changed hands shortly before one of Trump’s Iran posts sent crude lower and equities higher, while The Wall Street Journal described a burst of futures activity ahead of another Trump message that drew scrutiny across trading desks.
The economic climate for the week ahead sits inside that backdrop.
The market faces a geopolitical risk premium in oil, a rising probability of slower growth, and a political communications channel that now functions as an immediate pricing input.
Monday’s cross-asset move makes the interaction plain.
S&P 500 futures added to gains after Trump said the U.S. was in “serious discussions” with a “new, and more reasonable regime” in Iran.
The same message cycle has also included a threat to “completely obliterate” Iran’s energy and water infrastructure if a settlement failed to materialize.
That combination, conciliatory language on one side and escalation risk on the other, shaped the session. The Wall Street Journal reported WTI above $100 a barrel and Brent above $108, while Brent then surged above $116 as the conflict intensified.
Investors are now dealing with diplomacy and disruption at the same time, and the energy channel remains the main route into inflation, rates, and growth.
Bitcoin enters this equation with one structural advantage over every major U.S. risk asset.
It trades through all of it, through weekends, through Asia hours, through the periods when Wall Street’s core cash market is closed.
Bitcoin tracked the same macro shock as equities, then formed its own pattern while Wall Street was offline
Bitcoin’s value in this sequence comes from timing.
It trades continuously, so it acts as a live macro market when U.S. equities are closed.
That gives it two roles at once.
It responds to the same geopolitical inputs that move the S&P 500, and it also offers a real-time view of how those inputs are being absorbed outside the U.S. cash session.
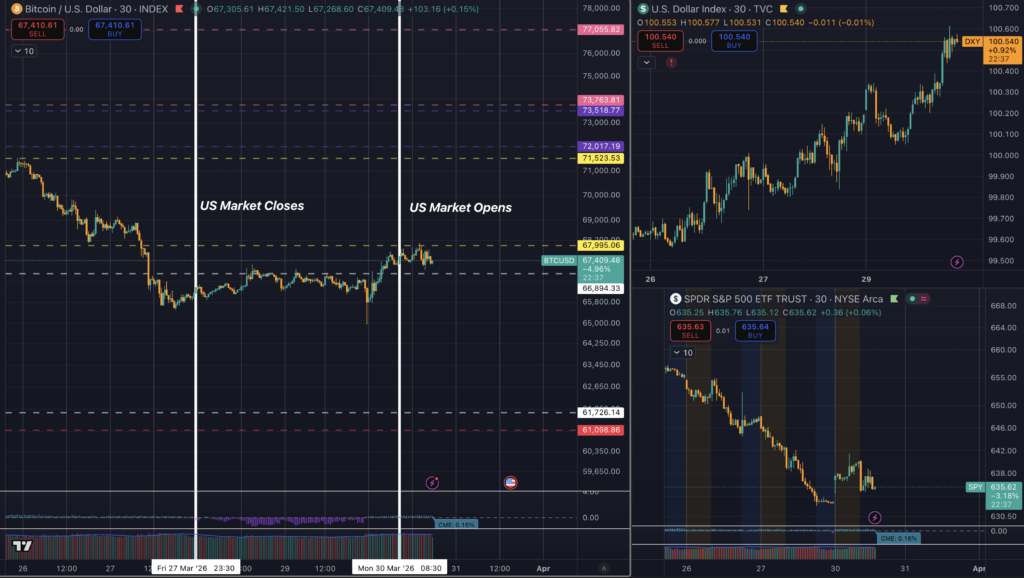
The pattern in the charts around this latest Iran-Trump sequence clearly carries that distinction.
Bitcoin sold off hard into the weekend and into the period around the U.S. close, then moved into a long stabilization band while U.S. equities sat offline.
Bitcoin price fell to the March 27 close, then spent much of the closeout period in a broad range around the mid- to upper $66,000s, before firming into the U.S. open on Monday.
The S&P’s intraday sequence was sharper and more discrete.
Bitcoin’s sequence was earlier, more continuous, and more gradual.
That broad structure lines up with broader market reporting from earlier in the month.
 Related Reading
Where is Bitcoin price headed this week? BTC falls to $65,000 but starts the week in recovery mode
Bitcoin drops to $65k but shows early recovery. Key levels, scenarios, and what must hold for BTC to regain upside momentum.
Mar 30, 2026 · Liam 'Akiba' WrightBitcoin was the first liquid asset to price the Iran war when the initial attack cycle began on a Saturday, dropping 8.5% while traditional markets were closed.
In the days that followed, Bitcoin slid as far as $67,300 before turning higher after Trump said the U.S. had begun talks with Iran. Bitcoin then climbed back above $71,000 when war concerns eased.
Bitcoin also slid below $68,500 last week as another round of mixed messaging from Iran whipsawed markets. There's a simple interpretation.
Bitcoin has been trading as a macro-sensitive asset throughout this conflict, with oil, rates, and political signals shaping direction.
The latest charts add a more refined point.
Bitcoin mirrored the S&P at the regime level, with both assets weakening under geopolitical stress and firming when Trump’s rhetoric shifted toward talks. Within that regime, the path diverged.
During the hours when the S&P cash market was closed, Bitcoin spent more time absorbing losses and building a base than extending a strong relief move.
The visible lift came closer to the U.S. open.
That timing suggests Bitcoin functioned as a pre-open sentiment gauge for the Monday rebound in equities, with the strongest upside leg appearing from around 00:01 UTC on Monday into the U.S. session.
The U.S. Dollar Index has also climbed steadily into Monday, which gives the move extra texture.
A firmer dollar usually tightens the backdrop for BTC and other risk assets.
Bitcoin’s ability to stabilize and then rise alongside a rising DXY points to a move driven by repricing around Iran and Trump’s messaging, supported by positioning and relief, with less help from the currency side of the macro equation.
Oil, payrolls, retail sales, and Bitcoin’s 24/7 signal define the week ahead
The macro calendar now arrives with crude oil at the center.
The Wall Street Journal said WTI had climbed roughly 50% since the U.S. and Israel began bombing Iran in late February.
Axios wrote that the OECD now sees U.S. inflation reaching 4.2% in 2026, up 1.2 percentage points from expectations in December, because the war and the energy shock have altered the inflation path.
That turns this week’s economic releases into a concentrated stress test.
- The Bureau of Labor Statistics says the March Employment Situation arrives Friday, April 3, at 8:30 a.m. ET.
- The Census Bureau says the delayed February advance retail sales release lands on April 1.
- The Institute for Supply Management says the March Manufacturing PMI will be released at 10:00 a.m. ET on Wednesday, April 1.
- The Bureau of Economic Analysis lists the next U.S. international trade release for Thursday, April 2.
Each of those reports now carries a second layer. Investors will judge growth through the lens of oil. That raises the pressure on every risk asset, including bitcoin.
Bitcoin has already outperformed many major assets at points during the stress.
The immediate week-ahead setup is narrower and more practical.
Bitcoin is serving as a high-beta macro instrument during geopolitical repricing, and it is also serving as a 24/7 discovery venue for sentiment shifts that hit outside U.S. cash hours.
That combination makes Bitcoin unusually useful right now.
If Trump posts over a weekend, bitcoin trades first.
If oil surges in Asia hours, bitcoin absorbs that input before New York.
If a diplomatic turn emerges in the early morning, bitcoin can begin revaluing risk before the S&P cash market gets a vote.
The unresolved question for the week sits exactly here.
Trump’s Iran posts have shown enough market impact to count as a working transmission channel, and traders have been watching these moments closely, including bursts of trading activity that arrived shortly before some of the posts.
Markets still need confirmation from events on the ground, from oil, and from the incoming U.S. data.
Bitcoin offers one of the clearest real-time views of how investors are processing that uncertainty.
The recent pattern suggests a sequence with three phases, initial risk repricing, stabilization through the closure, then a firmer advance into the U.S. reopen.
If that sequence repeats during the next round of Iran-related messaging, bitcoin’s weekend and overnight behavior will offer one of the earliest clues about whether traders see another temporary relief move forming, or whether the energy shock is taking control of the week.
The post Iran Speaker predicts pre-market “reverse indicator” then Bitcoin climbed before the S&P500 appeared first on CryptoSlate.