
The architecture, the optimization patterns, the war stories, and the senior engineer checklist I wish someone had handed me on day one.
Three years into my Snowflake career, I watched a single overnight job burn $4,000 in credits doing something that should have cost $12. That was the moment I stopped thinking about Snowflake as “just a cloud data warehouse” and started learning how it actually works.
Six years later, I inherited a $140K monthly bill. Three months after that, it was $38K. Same data, same teams, no new compute just the lessons in this guide applied in the right order.
This article is everything I learned across six years. The architecture. The optimization patterns. The pipeline designs. The governance mistakes. The war stories. And the principles I now live by. I framed it as a career arc because that’s honestly how I learned it not all at once from documentation, but progressively, usually when something broke.
If you’re earlier in your Snowflake journey, consider this a map. If you’re a few years in, you’ll recognize most of it and hopefully find a few things you haven’t hit yet.
Read this article for free: Link
TL;DR — What this guide covers
- The architecture that makes Snowflake’s cost model work for you or against you (sections 1–3)
- The 5 query optimization techniques that account for ~80% of real-world performance gains (section 4)
- The $140K → $38K case study with the exact findings, fixes, and credit impact for each (section 14)
- 10 best practices and 10 anti-patterns from six years of production work (sections 10–11)
- A senior engineer checklist you can run before any platform change (section 16)
If you only read one section, read 14. If you have 30 minutes, read 4, 10, 11, and 14 in that order.
The architecture nobody explains clearly enough
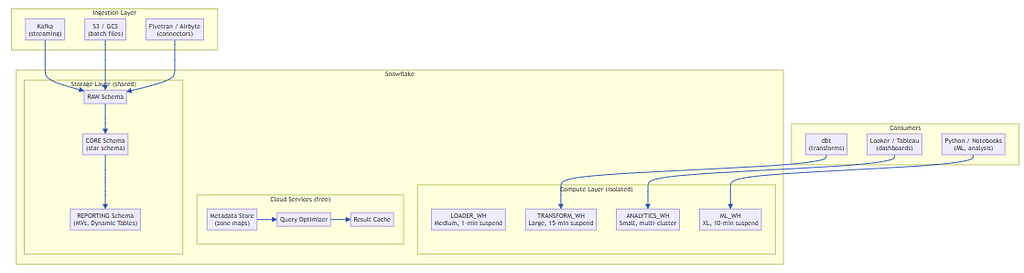
Snowflake separates three things that traditional databases lock together:
- Storage — your data, sitting on S3 / Azure Blob / GCS
- Compute — virtual warehouses that spin up and down on demand
- Services — query parsing, optimization, metadata, result caching
This separation is the core insight, formalised in Dageville et al. (2016), The Snowflake Elastic Data Warehouse, the original architecture paper published at ACM SIGMOD.
What it means in practice: ten teams can query the same underlying data simultaneously, each with their own compute cluster, none of them slowing each other down. When a warehouse suspends, your data stays put. You pay zero for storage idle time.
And here’s the kicker: when your warehouse suspends, your data stays put. Auto-suspend is your best friend for cost control.
The moment this clicked for me, I stopped thinking about Snowflake as a database and started thinking of it as a library where the catalogue (metadata) is separate from the books (data), and the reading rooms (warehouses) are rented by the hour. A great librarian finds your book using the catalogue alone. A poor one walks every aisle. Your job is to be the great librarian.
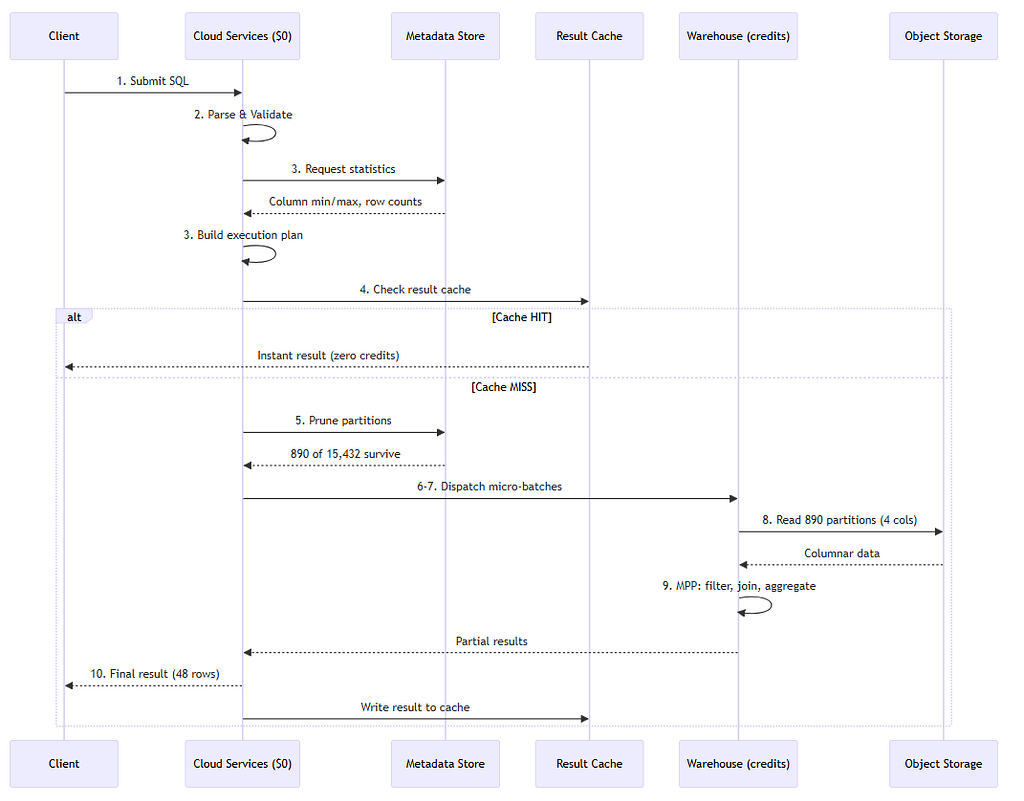
What happens when you press Run
I explained each and every steps when you hit a snowflake query → Read the deep dive on Medium
The billing model, honestly explained
There are three costs in Snowflake:
Compute: Credits per second the warehouse is active. An XS warehouse costs 1 credit/hour. A Large costs 8. Credits typically cost $2–$4 depending on your contract. A query that runs for 2 seconds on an XS warehouse costs roughly $0.001.
Storage: Around $23/TB/month for active data. Time Travel and Fail Safe add to this — configure retention tiers per table, not per account.
Cloud Services: Usually free (Snowflake covers up to 10% of daily warehouse credits). You only pay if your cloud services usage exceeds that threshold, which happens when you run thousands of tiny queries without activating a warehouse.
The mistake I see most often in year one: optimizing compute when storage is the real cost. A table with 90-day Time Travel on 10TB of raw data costs more per month than a well-configured warehouse.
Table of Contents
- The architecture nobody explains clearly enough
- What happens when you press Run
- The billing model, honestly explained
1. Foundations: Accounts, RBAC & Budgets
- 1.1 The Three Non-Negotiable Decisions
- 1.2 RBAC Hierarchy That Scales
- 1.3 Resource Monitors: Your Credit Circuit Breaker
- 1.4 Baseline Cost Query
3. Compute Optimization: Warehouses That Work
4. Query Optimization: The 80/20 of Performance
- 4.1 Reading the Query Profile
- 4.2 Technique 1 — Result Cache
- 4.3 Technique 2 — Column Pruning
- 4.4 Technique 3 — Predicate Pushdown
- 4.5 Technique 4 — QUALIFY vs Nested Window Subqueries
- 4.6 Technique 5 — Join Order & Pre-aggregation
5. Data Modeling for Performance
6. Pipelines: Incremental by Default
- 6.1 Streams for Change Data Capture
- 6.2 Tasks for Orchestration
- 6.3 MERGE with CDC (Including the Cluster Key)
- 6.4 Pipeline Architecture Diagram
7. Observability: If You Can’t See It, You Can’t Fix It
- 7.1 Top 10 Most Expensive Queries Yesterday
- 7.2 Daily Credit Burn by Warehouse
- 7.3 Warehouse Idle Time (Wasted Credits)
- 7.4 Storage Growth by Database
- 7.5 Observability Architecture
- 12.1 Profiling: Finding the Bottleneck
- 12.2 Optimization Benchmarks
- 12.3 Python — Dynamic Warehouse Resizing
13. Testing Strategy
- 13.1 dbt Tests: Schema and Data Quality
- 13.2 Pruning Validation Test
- 13.3 Load Test: Concurrency Validation
14. Case Study: The $140K Bill
- 14.1 What We Found
- 14.2 Results After Three Months
- 14.3 Key Lesson
15. End-to-End Implementation Project
- 15.1 Project Structure
- 15.2 Setup Commands
- 16.1 Account & Governance
- 16.2 Storage & Layout
- 16.3 Compute
- 16.4 Query Quality
- 16.5 Pipelines
- 16.6 Observability
- 17.1 Beginner
- 17.2 Intermediate
- 17.3 Senior
- 17.4 Architect Level
18. Conclusion
- 18.1 The Five Principles
- 18.2 What to Learn Next
19. References
1. Foundations: Accounts, RBAC & Budgets
Before a single query runs, your account structure determines your blast radius. One shared warehouse, one SYSADMIN role, and no resource monitors is a recipe for six‑figure bills.
1.1 The Three Non‑Negotiable Decisions

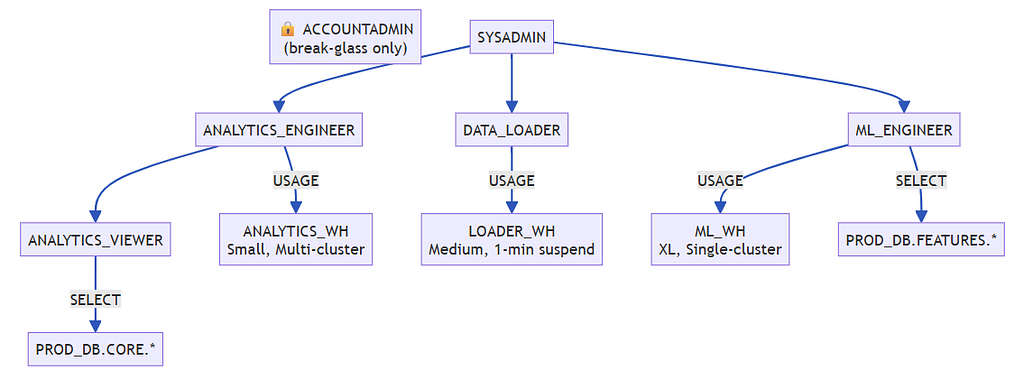
1.2 RBAC Hierarchy That Scales
-- Functional roles (do not grant to users directly)
CREATE ROLE ANALYTICS_ENGINEER;
CREATE ROLE ANALYTICS_VIEWER;
CREATE ROLE DATA_LOADER;

-- Hierarchy: parent inherits from child
GRANT ROLE ANALYTICS_VIEWER   TO ROLE ANALYTICS_ENGINEER;
GRANT ROLE ANALYTICS_ENGINEER TO ROLE SYSADMIN;
GRANT ROLE DATA_LOADER        TO ROLE SYSADMIN;

-- Object privileges – always include FUTURE
GRANT USAGE ON DATABASE PROD_DB TO ROLE ANALYTICS_ENGINEER;
GRANT USAGE ON SCHEMA PROD_DB.CORE TO ROLE ANALYTICS_ENGINEER;
GRANT SELECT ON ALL TABLES IN SCHEMA PROD_DB.CORE TO ROLE ANALYTICS_VIEWER;
GRANT SELECT ON FUTURE TABLES IN SCHEMA PROD_DB.CORE TO ROLE ANALYTICS_VIEWER;

-- Warehouse access
GRANT USAGE ON WAREHOUSE ANALYTICS_WH TO ROLE ANALYTICS_ENGINEER;
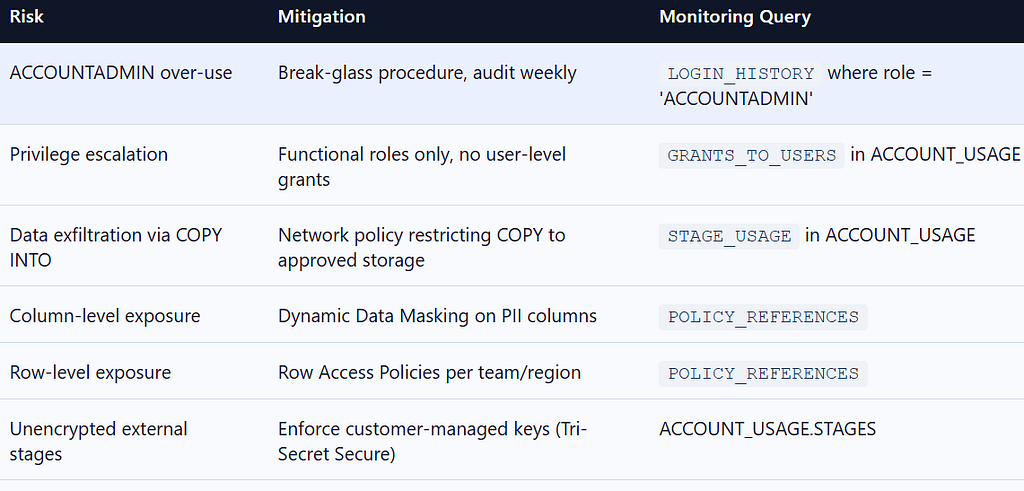
Golden rule: Never use ACCOUNTADMIN for daily work. Create a break‑glass procedure for it.
1.3 Resource Monitors: Your Credit Circuit Breaker
-- Account‑level hard stop
CREATE RESOURCE MONITOR ACCOUNT_GUARD
  WITH CREDIT_QUOTA = 500   -- adjust to your monthly budget
  FREQUENCY = MONTHLY
  TRIGGERS
    ON 75 PERCENT DO NOTIFY
    ON 90 PERCENT DO NOTIFY
    ON 100 PERCENT DO SUSPEND;

-- Per‑warehouse budget
CREATE RESOURCE MONITOR ANALYTICS_BUDGET
  WITH CREDIT_QUOTA = 100
  FREQUENCY = MONTHLY
  TRIGGERS
    ON 80 PERCENT DO NOTIFY
    ON 100 PERCENT DO SUSPEND_IMMEDIATE;

ALTER WAREHOUSE ANALYTICS_WH SET RESOURCE_MONITOR = ANALYTICS_BUDGET;
Baseline query — run this before any optimization to know where you stand:
SELECT
    warehouse_name,
    SUM(credits_used)                          AS total_credits,
    SUM(credits_used) * 3.00                   AS est_cost_usd,
    COUNT(DISTINCT DATE_TRUNC('day', start_time)) AS active_days
FROM SNOWFLAKE.ACCOUNT_USAGE.WAREHOUSE_METERING_HISTORY
WHERE start_time >= DATEADD('day', -30, CURRENT_TIMESTAMP())
GROUP BY warehouse_name
ORDER BY total_credits DESC;
2. Storage & Micro‑Partitions
The single biggest performance lever in Snowflake is how data is physically arranged on disk. Most “slow query” problems are actually storage‑layout problems.
2.1 Micro‑Partition Internals
- Every table is divided into micro‑partitions immutable, columnar, compressed files (50–500 MB uncompressed, ~16 MB compressed).
- Each partition stores zone map metadata: MIN and MAX for every column, null counts, distinct counts.
- Pruning = using that metadata to skip partitions without reading them. This happens before any compute credits are spent.
Micro‑Partition #4821
├── Rows: ~500,000
├── Compressed size: 18 MB
└── Metadata (zone map):
    ├── order_date:  MIN=2024-01-03  MAX=2024-01-05
    ├── region:      MIN='APAC'      MAX='EMEA'
    └── amount:      MIN=0.99        MAX=49,999.00
2.2 Clustering Keys: When and How
Add a clustering key only when:
- Table size > 500 GB, and
- Queries consistently filter on the same column(s), and
- You see partitions_scanned ≈ partitions_total in the Query Profile.

-- Step 1: Measure before adding a key
SELECT SYSTEM$CLUSTERING_INFORMATION(
    'PROD_DB.CORE.ORDERS', '(order_date)'
) AS clustering_info;
-- "average_depth" < 2.0 = good  |  > 4.0 = needs clustering
-- "average_overlaps" lower = better pruning

-- Step 2: Add key on confirmed candidate
ALTER TABLE PROD_DB.CORE.ORDERS CLUSTER BY (order_date);

-- High-cardinality: use DATE_TRUNC to reduce key cardinality
ALTER TABLE PROD_DB.CORE.EVENTS
  CLUSTER BY (DATE_TRUNC('month', event_timestamp), event_type);

-- Step 3: Measure pruning improvement weekly
SELECT
    query_id,
    partitions_scanned,
    partitions_total,
    ROUND(partitions_scanned / NULLIF(partitions_total, 0), 3) AS scan_ratio
FROM SNOWFLAKE.ACCOUNT_USAGE.QUERY_HISTORY
WHERE query_text ILIKE '%orders%'
  AND partitions_total > 0
  AND start_time >= DATEADD('day', -7, CURRENT_TIMESTAMP())
ORDER BY partitions_total DESC
LIMIT 50;
Cost warning: Automatic Clustering consumes credits. Monitor it with AUTOMATIC_CLUSTERING_HISTORY. If your data already arrives in roughly sorted order (e.g., event streams), you may not need it.
2.3 File Sizes Matter for COPY INTO
-- Check file size distribution from recent loads
SELECT
    file_name,
    row_count,
    file_size / (1024*1024) AS file_size_mb
FROM TABLE(INFORMATION_SCHEMA.COPY_HISTORY(
    TABLE_NAME => 'ORDERS',
    START_TIME => DATEADD('day', -7, CURRENT_TIMESTAMP())
))
ORDER BY file_size_mb;
Target: 100–250 MB per file before compression.
Too small (< 10 MB): thousands of tiny partitions, metadata overhead.
Too large (> 500 MB): suboptimal parallelism during load.
3. Compute Optimization: Warehouses That Work
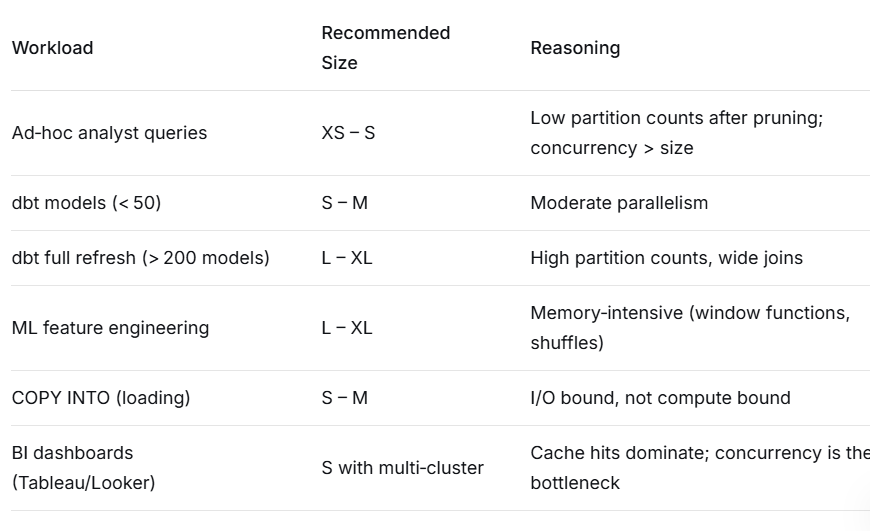
Warehouse sizing is not one‑time — it’s a continuous function of workload type, concurrency, and query complexity.
3.1 Sizing Decision Framework
3.2 Auto‑Suspend & Auto‑Resume
-- Interactive warehouse: suspend quickly, resume instantly
CREATE OR REPLACE WAREHOUSE ANALYTICS_WH
  WAREHOUSE_SIZE = 'SMALL'
  AUTO_SUSPEND = 300           -- 5 min: analysts work in bursts
  AUTO_RESUME = TRUE
  MIN_CLUSTER_COUNT = 1
  MAX_CLUSTER_COUNT = 3
  SCALING_POLICY = 'STANDARD';  -- add clusters immediately on queue

-- Batch transform: warm for pipeline window
CREATE OR REPLACE WAREHOUSE TRANSFORM_WH
  WAREHOUSE_SIZE = 'LARGE'
  AUTO_SUSPEND = 900           -- 15 min: pipeline runs sequentially
  AUTO_RESUME = TRUE;

-- Loader: aggressive suspend (only active during load windows)
CREATE OR REPLACE WAREHOUSE LOADER_WH
  WAREHOUSE_SIZE = 'MEDIUM'
  AUTO_SUSPEND = 60            -- 1 min: load, done, suspend
  AUTO_RESUME = TRUE;

-- Validate sizing with actual data before committing
SELECT
    warehouse_size,
    COUNT(*) AS query_count,
    AVG(execution_time) / 1000         AS avg_exec_seconds,
    AVG(bytes_spilled_to_remote_storage) AS avg_remote_spill
FROM SNOWFLAKE.ACCOUNT_USAGE.QUERY_HISTORY
WHERE warehouse_name = 'TRANSFORM_WH'
  AND start_time >= DATEADD('day', -30, CURRENT_TIMESTAMP())
GROUP BY warehouse_size;Multi‑cluster rule: STANDARD scaling adds clusters immediately – use for user‑facing dashboards. ECONOMY waits for queue buildup – use for batch pipelines.
3.3 When to Scale Up vs Scale Out
- Scale UP (bigger size) when: a single query spills to remote storage (check bytes_spilled_to_remote_storage in Query Profile). Doubling size often halves time → same credits, faster.
- Scale OUT (multi‑cluster) when: many concurrent queries queue. Adds clusters for concurrency, not single‑query speed.
4. Query Optimization: The 80/20 of Performance
Warehouse size is a red herring on 70% of slow queries. The real culprits live in the Query Profile.
4.1 The Query Profile — What to Look For

4.2 Technique 1: Result Cache — Zero Credits for Repeated Queries
Snowflake caches query results for 24 hours. The same SQL text + same objects = instant, free response.
Cache killers (non‑deterministic functions):
- CURRENT_TIMESTAMP(), CURRENT_DATE(), NOW()
- RANDOM(), UUID_STRING()
-- Cache killer: changes every run → fresh execution every time
SELECT * FROM orders WHERE load_ts > CURRENT_TIMESTAMP() - INTERVAL '1 hour';

-- Cache-friendly: static literal → reusable result
SELECT order_id, customer_id, amount
FROM orders
WHERE load_ts >= '2024-05-18 00:00:00';

-- Cache-busting functions to avoid in filter predicates:
-- CURRENT_TIMESTAMP(), CURRENT_DATE(), NOW(), RANDOM(), UUID_STRING()
-- SYSDATE(), GETDATE()
4.3 Technique 2: Column Pruning — Never Write SELECT *
-- Reads all columns (maybe 60) from storage
SELECT * FROM orders WHERE status = 'SHIPPED';

-- Reads only 4 columns – ~93% less I/O
SELECT order_id, customer_id, order_date, total_amount
FROM orders WHERE status = 'SHIPPED';
Audit tip: Search your codebase for SELECT * inside CTEs – those feed downstream joins and carry the I/O tax furthest.
4.4 Technique 3: Predicate Pushdown — Don’t Wrap Filter Columns
Pruning breaks the moment you wrap a column in a function.
-- Function on column → full scan, no pruning
WHERE DATE_TRUNC('month', event_ts) = '2024-01-01'
WHERE YEAR(order_date) = 2024

-- Direct range filter – pruning fires
WHERE event_ts  >= '2024-01-01' AND event_ts  < '2024-02-01'
WHERE order_date >= '2024-01-01' AND order_date < '2025-01-01'
4.5 Technique 4: QUALIFY Instead of Nested Window Subqueries
-- Subquery materialises entire ranked result set
SELECT * FROM (
  SELECT *, ROW_NUMBER() OVER (PARTITION BY customer_id ORDER BY order_date DESC) AS rn
  FROM orders
) WHERE rn = 1;

-- QUALIFY filters inline – single scan, no materialisation
SELECT *
FROM orders
QUALIFY ROW_NUMBER() OVER (PARTITION BY customer_id ORDER BY order_date DESC) = 1;
4.6 Technique 5: Join Order & Pre‑aggregation
-- Join then aggregate – processes 4B rows through join
SELECT c.region, SUM(o.amount)
FROM orders o JOIN customers c ON o.customer_id = c.customer_id
WHERE o.order_date >= '2024-01-01'
GROUP BY c.region;

-- Aggregate first, then join – reduces join input by 99%
WITH regional_orders AS (
    SELECT customer_id, SUM(amount) AS customer_revenue
    FROM orders WHERE order_date >= '2024-01-01'
    GROUP BY customer_id
)
SELECT c.region, SUM(r.customer_revenue)
FROM regional_orders r JOIN customers c ON r.customer_id = c.customer_id
GROUP BY c.region;
5. Data Modeling for Performance
Good modeling is query optimization that runs before the query is even written.
5.1 Star Schema Basics
-- Fact table: narrow, clustered on the most common filter
CREATE TABLE PROD_DB.CORE.FCT_ORDERS (
    order_sk        NUMBER AUTOINCREMENT PRIMARY KEY,
    customer_sk     NUMBER NOT NULL,
    product_sk      NUMBER NOT NULL,
    date_sk         NUMBER NOT NULL,   -- YYYYMMDD integer
    order_date      DATE NOT NULL,
    amount          NUMBER(18,2),
    status          VARCHAR(20)
)
CLUSTER BY (order_date);

-- Dimension table: SCD Type 2
CREATE TABLE PROD_DB.CORE.DIM_CUSTOMERS (
    customer_sk     NUMBER AUTOINCREMENT PRIMARY KEY,
    customer_id     VARCHAR(36) NOT NULL,
    segment         VARCHAR(50),
    region          VARCHAR(50),
    valid_from      DATE NOT NULL,
    valid_to        DATE,
    is_current      BOOLEAN DEFAULT TRUE
)
CLUSTER BY (is_current);
5.2 Materialized Views vs Dynamic Tables
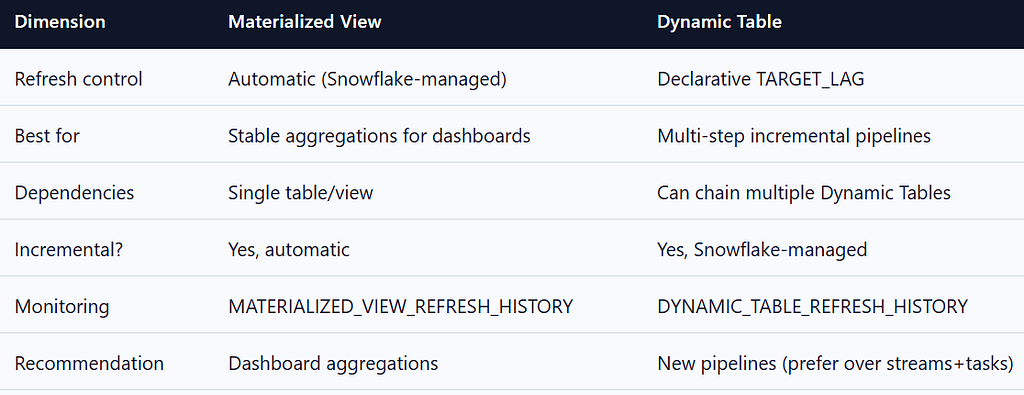
-- Materialized view – automatic, best for dashboards
CREATE MATERIALIZED VIEW PROD_DB.REPORTING.MV_DAILY_REVENUE AS
SELECT DATE_TRUNC('day', order_date) AS day, region, SUM(amount) AS revenue
FROM FCT_ORDERS o JOIN DIM_CUSTOMERS c ON o.customer_sk = c.customer_sk
WHERE c.is_current
GROUP BY 1, 2;

-- Dynamic table – declarative incremental pipeline
CREATE DYNAMIC TABLE PROD_DB.REPORTING.DT_CUSTOMER_LTV
  TARGET_LAG = '1 hour'
  WAREHOUSE = TRANSFORM_WH
AS
SELECT customer_id, SUM(amount) AS lifetime_revenue
FROM FCT_ORDERS GROUP BY customer_id;
6. Pipelines: Incremental by Default
Full reloads are a failure of pipeline design, not a cost of doing business.
6.1 Streams for Change Data Capture
-- Create a stream on the raw table
CREATE STREAM PROD_DB.RAW.ORDERS_STREAM
  ON TABLE PROD_DB.RAW.ORDERS
  APPEND_ONLY = FALSE;   -- captures inserts, updates, deletes

-- Process only new rows
INSERT INTO PROD_DB.CORE.FCT_ORDERS (customer_sk, order_date, amount)
SELECT c.customer_sk, s.order_date, s.amount
FROM PROD_DB.RAW.ORDERS_STREAM s
JOIN PROD_DB.CORE.DIM_CUSTOMERS c ON s.customer_id = c.customer_id AND c.is_current
WHERE s.METADATA$ACTION = 'INSERT';
CriticalStreams expire after 14 days without consumption. Monitor staleness with INFORMATION_SCHEMA.STREAMS. Build an alert for any stream not consumed in 7 days.
6.2 Tasks for Orchestration
-- Root task: scheduled hourly, checks for data
CREATE OR REPLACE TASK PROD_DB.PIPELINES.PIPELINE_ROOT
  WAREHOUSE = LOADER_WH
  SCHEDULE = 'USING CRON 0 * * * * UTC'
AS
  SELECT SYSTEM$STREAM_HAS_DATA('PROD_DB.RAW.ORDERS_STREAM');

-- Child task: only runs if stream has data (cost-free idle)
CREATE OR REPLACE TASK PROD_DB.PIPELINES.PROCESS_ORDERS
  WAREHOUSE = TRANSFORM_WH
  AFTER PROD_DB.PIPELINES.PIPELINE_ROOT
AS
  CALL PROD_DB.PROCEDURES.PROCESS_ORDER_STREAM();

-- Tasks are suspended by default — always resume explicitly
ALTER TASK PROD_DB.PIPELINES.PROCESS_ORDERS RESUME;
ALTER TASK PROD_DB.PIPELINES.PIPELINE_ROOT  RESUME;Streams expire after 14 days — monitor staleness in INFORMATION_SCHEMA.STREAMS.
6.3 MERGE with CDC: Include the Cluster Key
MERGE INTO PROD_DB.CORE.FCT_ORDERS AS target
USING (
    SELECT customer_sk, order_date, amount, METADATA$ACTION
    FROM   PROD_DB.RAW.ORDERS_STREAM
    WHERE  METADATA$ACTION = 'INSERT'
) AS source
ON  target.order_id   = source.order_id
AND target.order_date = source.order_date  -- include cluster key → enables pruning on target!
WHEN MATCHED    THEN UPDATE SET amount = source.amount
WHEN NOT MATCHED THEN INSERT (customer_sk, order_date, amount)
    VALUES (source.customer_sk, source.order_date, source.amount);
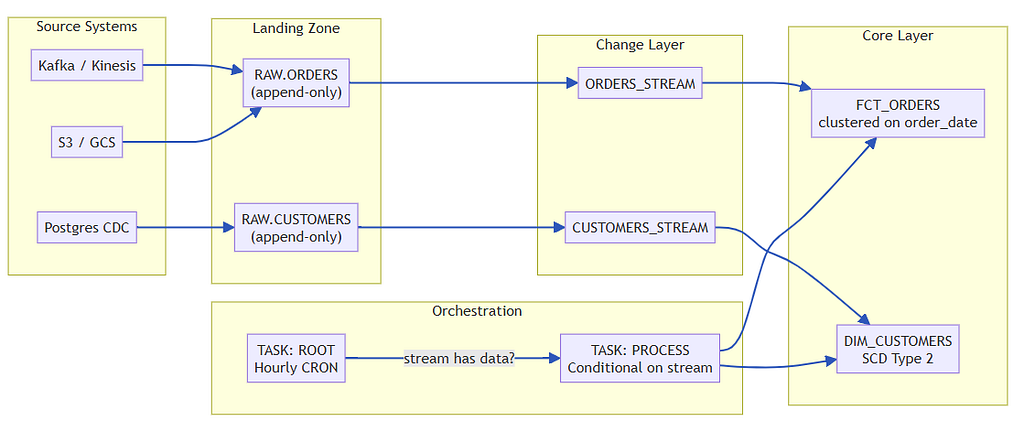
6.4 Pipeline Architecture
7. Observability: If You Can’t See It, You Can’t Fix It
The five queries every platform team should run daily.

7.1 Top 10 Most Expensive Queries Yesterday
SELECT
    query_text,
    user_name,
    warehouse_name,
    execution_time / 1000 AS exec_seconds,
    credits_used_cloud_services,
    partitions_scanned,
    partitions_total,
    ROUND(partitions_scanned / NULLIF(partitions_total, 0), 2) AS scan_ratio,
    bytes_spilled_to_remote_storage / (1024^3) AS gb_spilled
FROM SNOWFLAKE.ACCOUNT_USAGE.QUERY_HISTORY
WHERE DATE_TRUNC('day', start_time) = DATEADD('day', -1, CURRENT_DATE())
  AND execution_status = 'SUCCESS'
ORDER BY execution_time DESC
LIMIT 10;
7.2 Daily Credit Burn by Warehouse
SELECT
    DATE_TRUNC('day', start_time) AS usage_date,
    warehouse_name,
    SUM(credits_used) AS daily_credits,
    SUM(credits_used) * 3.0 AS est_usd
FROM SNOWFLAKE.ACCOUNT_USAGE.WAREHOUSE_METERING_HISTORY
WHERE start_time >= DATEADD('day', -30, CURRENT_TIMESTAMP())
GROUP BY 1, 2
ORDER BY 1 DESC, 3 DESC;
7.3 Warehouse Idle Time (Wasted Credits)
SELECT
    warehouse_name,
    SUM(CASE WHEN credits_used = 0 THEN 1 ELSE 0 END) AS idle_hours,
    SUM(credits_used)                                   AS active_credits,
    ROUND(idle_hours / COUNT(*), 2)                   AS idle_ratio
FROM SNOWFLAKE.ACCOUNT_USAGE.WAREHOUSE_METERING_HISTORY
WHERE start_time >= DATEADD('day', -30, CURRENT_TIMESTAMP())
GROUP BY 1
HAVING idle_ratio > 0.3
ORDER BY idle_ratio DESC;
7.4 Storage Growth by Database (Week over Week)
SELECT
    database_name,
    DATE_TRUNC('week', usage_date) AS week,
    AVG(average_database_bytes) / (1024^3) AS avg_gb
FROM SNOWFLAKE.ACCOUNT_USAGE.DATABASE_STORAGE_USAGE_HISTORY
WHERE usage_date >= DATEADD('day', -60, CURRENT_DATE())
GROUP BY 1, 2
ORDER BY 1, 2;
ACCOUNT_USAGE latency is 45 minutesFor real-time monitoring during an active incident, query INFORMATION_SCHEMA.QUERY_HISTORY() (table function) — zero latency, but session-scoped and limited to 7-day history.
7.5 Observability Architecture

8. Security & Governance
8.1 Key Risks and Mitigations
8.2 Dynamic Data Masking
-- Mask email: analysts see hash, admins see plaintext
CREATE OR REPLACE MASKING POLICY mask_email
  AS (val STRING) RETURNS STRING ->
    CASE
      WHEN CURRENT_ROLE() IN ('SYSADMIN', 'DATA_STEWARD') THEN val
      ELSE SHA2(val)
    END;

ALTER TABLE DIM_CUSTOMERS
  MODIFY COLUMN email SET MASKING POLICY mask_email;
8.3 Row Access Policies
-- Restrict rows by region: each team sees only their region's data
CREATE OR REPLACE ROW ACCESS POLICY region_policy
  AS (row_region VARCHAR) RETURNS BOOLEAN ->
    CURRENT_ROLE() = 'SYSADMIN'
    OR EXISTS (
      SELECT 1
      FROM PROD_DB.SECURITY.TEAM_REGION_MAP
      WHERE role_name = CURRENT_ROLE()
        AND region   = row_region
    );

ALTER TABLE FCT_ORDERS
  ADD ROW ACCESS POLICY region_policy ON (region);
9. Architecture Diagrams
9.1 Full Platform Architecture
9.2 Query Execution Sequence
10 Best Practices
1. Measure before you optimize
Every optimization starts with a query against ACCOUNT_USAGE. Never resize a warehouse, add a clustering key, or rewrite a query without first measuring the baseline. Gut feel is not a debugging strategy.
2. Clustering keys must match your actual filter predicates
A clustering key on order_date only helps queries that filter on order_date. Before adding a key, audit the top 20 queries against that table and verify they all filter on the same column.
3. GRANT ON FUTURE TABLES everywhere
If you don’t, every new table or view becomes a support ticket. Apply future grants at schema creation time, not after the fact.
4. One resource monitor per warehouse, minimum
Account-level monitors are a safety net. Warehouse-level monitors are your actual budget controls. Set them before any team gets warehouse access.
5. Auto-suspend aggressive, auto-resume always on
5 minutes for interactive, 15 for batch, 1 for loaders. The ~5-second resume latency is almost never a user-facing problem. The credits saved over 30 days almost always are.
6. Include the cluster key in all MERGE conditions
If your MERGE target is clustered on order_date and your merge condition includes order_date = source.order_date, Snowflake prunes the target before scanning. Without it, the entire target table is scanned.
7. Use Dynamic Tables for new incremental pipelines
Dynamic Tables replace most streams+tasks patterns with a declarative, monitored, lag-controlled approach. For any new pipeline, start with a Dynamic Table and fall back to streams+tasks only when you need procedural control.
8. Pre-aggregate before joining large tables
Joining then aggregating processes the full cartesian product before reducing. Aggregating first shrinks the join input by orders of magnitude. This is the single highest-ROI query rewrite pattern in Snowflake.
9. Export key metrics to an external observability system
ACCOUNT_USAGE has 45-minute latency. Your observability system should not go down when Snowflake has issues. Push daily summaries to Datadog, Grafana, or similar.
10. Test your hypotheses with data, not assumptions
Before every optimization, write down what you expect to change and by how much. After the change, measure. If the result doesn’t match the hypothesis, investigate before moving on. Optimization without measurement is just luck.
10 Anti-Patterns
1. SELECT * in production queries
Reads every column from every scanned partition. On a 60-column table, you are paying for 56 columns you don’t use. The fix takes 30 seconds and the savings are immediate.
2. Upsizing the warehouse before checking the Query Profile
The most common waste pattern. A warehouse upsize costs 2x the credits. If the query isn’t spilling to storage, the upsize will not help. Check bytes_spilled_to_remote_storage first.
3. Wrapping filter columns in functions
WHERE YEAR(order_date) = 2024 disables pruning on the order_date column entirely. Snowflake cannot compare the result of YEAR() against the stored min/max values. Always use direct range predicates.
4. Full truncate-and-reload on large tables
A full reload on a 1TB table re-reads every source partition on every run. If the data is 95% unchanged, you are paying for the 5% 20 times over. Implement incremental logic with streams or MERGE.
5. One warehouse for all workloads
A shared warehouse makes cost invisible, creates contention, and prevents right-sizing. When the BI dashboard team and the ML feature pipeline share a warehouse, neither gets what they need and nobody knows why the bill is high.
6. Non-deterministic functions in filter predicates
WHERE created_at > CURRENT_TIMESTAMP() - INTERVAL '1 day' busts the result cache on every execution. Replace with parameterized static values or use DATE_TRUNC to create stable time boundaries.
7. Ignoring stream staleness
A stream that passes its 14-day extended data retention window without consumption will fail silently. You lose the ability to replay changes. Monitor INFORMATION_SCHEMA.STREAMS and alert at 7 days.
8. Applying clustering without measuring clustering quality first
Automatic Clustering consumes background credits. If your data already arrives in near-sorted order (time-series event streams), adding a clustering key wastes money on reclustering work that is already done.
9. No QUERY_TAG on production queries
Without query tags, ACCOUNT_USAGE.QUERY_HISTORY is a mystery. You cannot attribute cost to teams, models, or pipeline runs. Set QUERY_TAG at session level in every dbt profile and data loader configuration.
10. Using ACCOUNTADMIN for routine operations
ACCOUNTADMIN has no restrictions. A dropped database, a truncated table, or a misconfigured resource monitor executed under ACCOUNTADMIN cannot be stopped by any guardrail. Create functional roles for all routine work and audit every use of ACCOUNTADMIN.
12. Performance Engineering
12.1 Profiling: Finding the Bottleneck
-- Find all queries with remote storage spill (memory-bound)
SELECT
    query_id,
    query_text,
    warehouse_name,
    execution_time / 1000                                AS exec_sec,
    bytes_spilled_to_remote_storage / (1024^3)           AS gb_remote_spill,
    bytes_spilled_to_local_storage  / (1024^3)           AS gb_local_spill
FROM SNOWFLAKE.ACCOUNT_USAGE.QUERY_HISTORY
WHERE start_time >= DATEADD('day', -7, CURRENT_TIMESTAMP())
  AND bytes_spilled_to_remote_storage > 0
ORDER BY gb_remote_spill DESC;
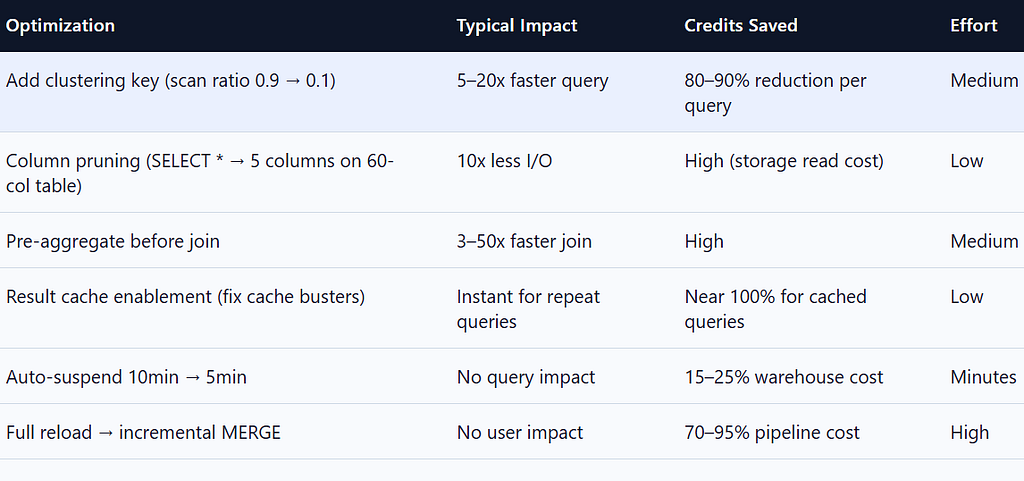
12.1 Optimization Benchmarks
12.2 Python: Dynamic Warehouse Resizing
import snowflake.connector
from contextlib import contextmanager

@contextmanager
def warehouse_size(conn, warehouse: str, size: str):
    """Context manager: temporarily resize a warehouse for expensive queries."""
    cursor = conn.cursor()
    try:
        cursor.execute(f"ALTER WAREHOUSE {warehouse} SET WAREHOUSE_SIZE = '{size}'")
        yield cursor
    finally:
        cursor.execute(f"ALTER WAREHOUSE {warehouse} SET WAREHOUSE_SIZE = 'SMALL'")
        cursor.close()

# Usage: upsize only for the expensive model, downsize immediately after
with warehouse_size(conn, 'TRANSFORM_WH', 'XLARGE') as cursor:
    cursor.execute("CALL PROD_DB.PROCEDURES.RUN_EXPENSIVE_MODEL()")
    result = cursor.fetchall()
# Warehouse is back to SMALL here
13. Testing Strategy
13.1 dbt Tests: Schema and Data Quality
# models/core/schema.yml
models:
  - name: fct_orders
    tests:
      - not_null:
          columns: [order_sk, customer_sk, order_date, amount]
      - unique:
          column_name: order_sk
      - relationships:
          to: ref('dim_customers')
          field: customer_sk

    columns:
      - name: amount
        tests:
          - dbt_utils.accepted_range:
              min_value: 0
              max_value: 1000000
      - name: order_date
        tests:
          - dbt_utils.not_future_date
13.2 Pruning Validation Test
import snowflake.connector
import pytest

def get_scan_ratio(conn, query: str) -> float:
    cursor = conn.cursor()
    cursor.execute(query)
    last_qid = cursor.sfqid
    cursor.execute(f"""
        SELECT partitions_scanned / NULLIF(partitions_total, 0)
        FROM INFORMATION_SCHEMA.QUERY_HISTORY_BY_ID('{last_qid}')
    """)
    result = cursor.fetchone()
    return result[0] if result else 1.0

def test_clustering_key_prunes_effectively(snowflake_conn):
    """Validate that clustering key reduces partition scan ratio below 0.2."""
    query = """
        SELECT SUM(amount) FROM PROD_DB.CORE.FCT_ORDERS
        WHERE order_date BETWEEN '2024-04-01' AND '2024-06-30'
    """
    scan_ratio = get_scan_ratio(snowflake_conn, query)
    assert scan_ratio < 0.2, f"Pruning degraded: scan_ratio={scan_ratio:.2f} (expected < 0.20)"

def test_result_cache_hit(snowflake_conn):
    """Run the same query twice; second execution should be cached."""
    query = "SELECT COUNT(*) FROM PROD_DB.CORE.FCT_ORDERS WHERE status = 'SHIPPED'"
    for _ in range(2):
        snowflake_conn.cursor().execute(query)
    # Second execution should complete in under 200ms (cache hit)
    cursor = snowflake_conn.cursor()
    cursor.execute(f"""
        SELECT execution_time FROM INFORMATION_SCHEMA.QUERY_HISTORY
        WHERE query_text ILIKE '%status = SHIPPED%'
        ORDER BY start_time DESC LIMIT 1
    """)
    exec_ms = cursor.fetchone()[0]
    assert exec_ms < 200, f"Expected cache hit but took {exec_ms}ms"
13.3 Load Test: Concurrency Validation
import concurrent.futures
import time

def run_dashboard_query(conn_params: dict, query_id: int) -> dict:
    conn = snowflake.connector.connect(**conn_params)
    start = time.time()
    conn.cursor().execute("""
        SELECT region, SUM(amount) FROM PROD_DB.REPORTING.MV_DAILY_REVENUE
        WHERE revenue_date >= DATEADD('day', -30, CURRENT_DATE())
        GROUP BY region
    """)
    elapsed = time.time() - start
    conn.close()
    return {"query_id": query_id, "elapsed_seconds": elapsed}

def test_concurrent_dashboard_load(conn_params, n_users=20):
    """Simulate 20 concurrent dashboard users; all should complete within 5s."""
    with concurrent.futures.ThreadPoolExecutor(max_workers=n_users) as executor:
        futures = [executor.submit(run_dashboard_query, conn_params, i) for i in range(n_users)]
        results = [f.result() for f in concurrent.futures.as_completed(futures)]

    slow = [r for r in results if r["elapsed_seconds"] > 5]
    assert len(slow) == 0, f"{len(slow)} queries exceeded 5s SLA: {slow}"
14. Case Study: The $140K Bill
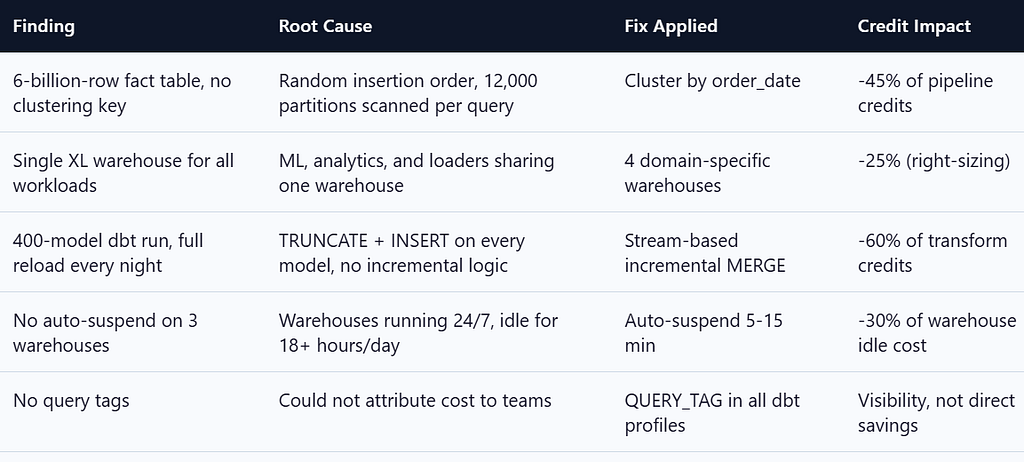
A real account. Three months of work. The numbers changed from a $140K monthly bill to $38K with the same data volume and the same teams.
14.1 What We Found
14.2 Result After 3 Months

14.3 Key lesson
In every case, the fix was understanding the system — not buying more compute. The machine was always fast. It just needed someone who understood the levers.
15. End-to-End Implementation Project
A working project structure for applying all the optimization patterns in this guide.
15.1 Project Structure
snowflake-optimization/
├── README.md
├── .env.example                 # Snowflake credentials template
├── setup/
│   ├── 01_rbac.sql              # Roles, grants, future grants
│   ├── 02_warehouses.sql        # Domain warehouses + resource monitors
│   └── 03_schemas.sql           # Database / schema structure
├── models/
│   ├── raw/
│   │   └── orders.sql           # Landing table
│   ├── core/
│   │   ├── fct_orders.sql       # Star schema fact table
│   │   └── dim_customers.sql    # SCD Type 2 dimension
│   └── reporting/
│       ├── mv_daily_revenue.sql # Materialized view
│       └── dt_customer_ltv.sql  # Dynamic table
├── pipelines/
│   ├── streams.sql              # CDC streams
│   ├── tasks.sql                # Task orchestration
│   └── merge_procedures.sql     # Incremental merge stored procs
├── observability/
│   ├── views/
│   │   ├── vw_query_slo.sql
│   │   ├── vw_cost_by_team.sql
│   │   └── vw_pruning_opps.sql
│   └── alerts/
│       └── daily_cost_check.py  # Slack alert script
├── tests/
│   ├── test_pruning.py
│   ├── test_cache.py
│   └── test_concurrency.py
└── dbt_project/
├── dbt_project.yml
├── profiles.yml
└── models/
└── core/
└── schema.yml
15.2 Setup Commands
# Clone and configure
git clone https://github.com/example/snowflake-optimization
cd snowflake-optimization
cp .env.example .env
# Fill in SNOWFLAKE_ACCOUNT, SNOWFLAKE_USER, SNOWFLAKE_PASSWORD, SNOWFLAKE_ROLE

# Run setup in order
snowsql -f setup/01_rbac.sql
snowsql -f setup/02_warehouses.sql
snowsql -f setup/03_schemas.sql

# Load sample data
python scripts/generate_sample_data.py --rows 10000000
snowsql -q "COPY INTO RAW.ORDERS FROM @RAW_STAGE/orders/ FILE_FORMAT = (TYPE='PARQUET')"

# Run dbt models
cd dbt_project
dbt deps
dbt run --select core.*
dbt run --select reporting.*

# Deploy pipelines
snowsql -f pipelines/streams.sql
snowsql -f pipelines/tasks.sql

# Run tests
pytest tests/ -v --tb=short

# Validate optimization
python observability/validate_optimization.py
16. Senior Engineer Checklist
Use this before signing off on any Snowflake platform change.
16.1 Account & Governance
RBAC hierarchy with functional roles (no direct grants to users)
- GRANT ON FUTURE TABLES applied to all schemas
- Resource monitor on every warehouse (not just account level)
- STATEMENT_TIMEOUT_IN_SECONDS set per warehouse
- ACCOUNTADMIN usage restricted and audited
16.2 Storage & Layout
- Clustering key on all fact tables > 500 GB
- SYSTEM$CLUSTERING_INFORMATION reviewed monthly for all clustered tables
- COPY INTO file sizes: 100–250 MB uncompressed
- TIME_TRAVEL retention configured per tier (raw=1d, staging=7d, curated=90d)
16.3 Compute
- Domain‑specific warehouses (analytics, transform, load, ML) — no sharing
- Auto‑suspend: 5 min for interactive, 15 min for batch, 1 min for loaders
- Multi‑cluster on BI warehouses with SCALING_POLICY = STANDARD
- Warehouse sizes validated against Query Profile, not gut feel
16.4 Query Quality
- No SELECT * in production queries
- Query Profile reviewed for all queries > 60 seconds
- QUERY_TAG set in all dbt profiles and pipelines
- Pruning ratio < 0.4 for all high‑frequency queries
16.5 Pipelines
- Incremental logic: streams, dynamic tables, or MERGE with CDC
- No full truncate‑and‑reload on tables > 100 GB
- Task error handling: SYSTEM$TASK_HISTORY monitored
- Stream staleness monitored — no stream > 7 days without consumption
16.6 Observability
- Daily cost‑by‑warehouse report running
- SLO views (p95, compliance_rate) built and dashboarded
- Top‑10 expensive queries reviewed weekly
- Storage growth trend reviewed monthly
17. Interview Questions
17.1 Beginner
- What is a micro-partition in Snowflake? How many rows does a typical micro-partition contain, and what metadata does it store?
- What is auto-suspend in Snowflake? What is the default value, and what happens to queries in flight when a warehouse suspends?
- Explain the result cache. What conditions must be true for a query to be served from cache?
17.2 Intermediate
- A query has scan_ratio = 0.95 in QUERY_HISTORY. What does this tell you? What are the possible causes, and how would you fix each?
- When should you choose SCALING_POLICY = ‘ECONOMY’ versus ‘STANDARD’ for a multi-cluster warehouse? What is the trade-off?
- Explain the difference between a Snowflake stream with APPEND_ONLY = TRUE and APPEND_ONLY = FALSE. When would you use each?
- Why does WHERE DATE_TRUNC('month', order_date) = '2024-01-01' perform worse than WHERE order_date BETWEEN '2024-01-01' AND '2024-01-31'? What is the mechanism?
17.3 Senior
- Your dbt pipeline runs 200 models nightly on a single LARGE warehouse. Some models take 90 minutes, most take 30 seconds. What changes would you make to reduce cost and duration? Walk through your reasoning step by step.
- A table has a clustering key on order_date. After 6 months of use, pruning performance has degraded (scan ratio increased from 0.1 to 0.6). What likely happened, and what are your options?
- You need to implement SCD Type 2 for a 500M-row customers table using Snowflake streams and tasks. Walk through the complete design, including the MERGE statement, task dependency, and how you handle late-arriving records.
17.4 Architect Level
- Design a multi-team Snowflake platform for 8 teams (analytics, ML, data science, 2 product teams, data loading, reporting, security). Define the warehouse strategy, RBAC hierarchy, resource monitor design, and observability stack. Justify every decision.
- Your organization needs to demonstrate SOC 2 compliance for its Snowflake deployment. What controls would you implement? Include masking policies, row access policies, network policies, audit logging, and key management. What are the operational trade-offs of each control?
18. Conclusion
Three months after applying these principles to a real account, the $140K bill was $38K. Same data volume, same teams. The two-hour nightly pipeline ran in fourteen minutes. The 6-billion-row fact table scanned 8% of its partitions instead of 94%. Engineers could see their own spend, attribute it to their own models, and fix it themselves.
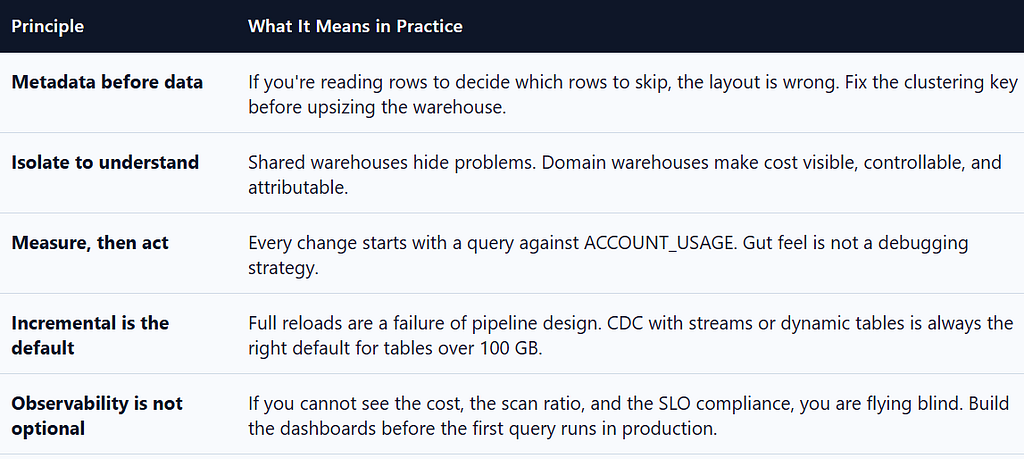
18.1 The Five Principles
18.2 What to learn next
Dynamic Tables: The future of Snowflake pipelines.
Snowflake Cortex : Native LLM and vector search for AI pipelines in the same platform. dbt Incremental Models → the application layer for incremental ELT at scale.
I’m planning to write more. Snowflake, Databricks, Data Engineering, and real‑time experience. The stuff I broke and fixed. The midnight firefights. The “why did no one document this” moments.
If you want to read those, clap for this article, subscribe, and drop a comment below. Tell me what you’re struggling with. I might write that next.
And if you haven’t already, I explained each and every step when you hit a Snowflake query. → Read the deep dive on Medium
Let me know if you want me to write something specific. Happy to share the scars.
19. References
- Dageville, B., et al. (2016). The Snowflake Elastic Data Warehouse. ACM SIGMOD.
- Selinger, P. G., et al. (1979). Access Path Selection in a Relational Database Management System. ACM SIGMOD.
- Stonebraker, M. (1986). The Case for Shared Nothing. IEEE Database Engineering Bulletin.
- DeWitt, D., & Gray, J. (1992). Parallel Database Systems: The Future of High Performance Database Systems. Communications of the ACM.
- Abadi, D. J., et al. (2008). Column-Stores vs. Row-Stores: How Different Are They Really? ACM SIGMOD.
- Kimball, R., & Ross, M. (2013). The Data Warehouse Toolkit, 3rd Edition. Wiley.
- Snowflake Inc. Architecture Overview.
- Snowflake Inc. Micro-partitions & Data Clustering.
- Snowflake Inc. Virtual Warehouses Overview.
- Snowflake Inc. Using Persisted Query Results.
- Snowflake Inc. Analyzing Queries Using Query Profile.
- Snowflake Inc. Streams & Tasks.
- Snowflake Inc. Dynamic Tables.
- Snowflake Inc. ACCOUNT_USAGE Schema.
- Snowflake Inc. Resource Monitors.
- dbt Labs. How We Structure Our dbt Projects. (Accessed May 2026.)
I Inherited a $140K Snowflake Bill — Three Months Later It Was $38K. Here’s Everything I Learned. was originally published in Level Up Coding on Medium, where people are continuing the conversation by highlighting and responding to this story.
