7 Key ICT Trading Concepts Every Beginner Must Understand
 Daniel Müller6 min read·Just now
--
If you are a trader who is just getting started with day trading, I’m sure that you’ve heard of a guy named, Inner Circle Trader (ICT). His day trading strategy is probably one of the most widely adopted and known. He also posted hundreds of hours of videos teaching people trading for free.
In this blog, we want to save you some hours and explore seven essential Inner Circle Trader (ICT) trading concepts that every beginner should know. We’ll also introduce you to a specialized indicator
1. Market Structure
Understanding the Blueprint of Price Movements
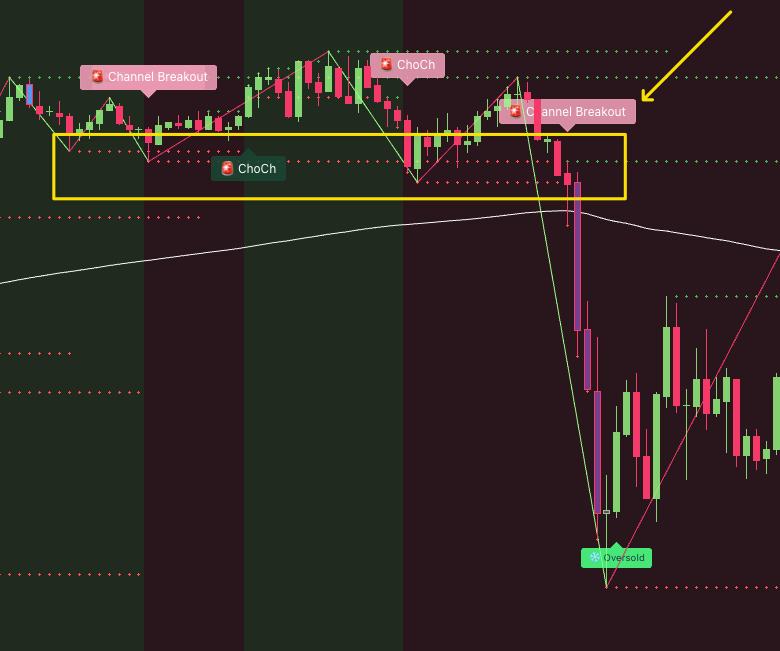
Market structure is the cornerstone of technical analysis in trading. It refers to the way the price of an asset moves over time, forming patterns that indicate the overall direction — be it an uptrend, downtrend, or sideways movement.
Why It’s Important:
- Trend Identification: Recognizing patterns of higher highs and higher lows indicates a bullish trend, while lower highs and lower lows signify a bearish trend. This knowledge is essential for aligning your trades with the market direction.
- Key Levels: Understanding market structure helps in identifying support and resistance levels, which are critical for determining entry and exit points.
- Risk Management: A clear grasp of market trends allows for better stop-loss placements, protecting your investments.
Simplify with Our Indicator:
Our specialized indicator takes the complexity out of market structure analysis by automatically highlighting key levels and trends on your price charts. It identifies:
- Trend Directions: Visually represent bullish and bearish trends.
- Support and Resistance Levels: Marks significant highs and lows.
- Potential Reversal Points: Alerts you to possible changes in the market direction.
Press enter or click to view image in full size
2. Order Blocks
Decoding the Footprints of Major Market Players
Order blocks are specific zones on the price chart where a substantial number of buy or sell orders have been executed, usually by large institutional traders. These areas often precede significant market moves and can act as strong support or resistance levels.
Why They’re Important:
- Market Insights: Order blocks reveal where large market participants are placing their trades, providing clues about future price movements.
- Strategic Entry and Exit Points: Identifying these zones can help you align your trades with the actions of institutional investors.
Enhance with Our Indicator:
Our indicator identifies and marks order blocks directly on your charts, enabling you to:
- Spot Key Zones: Easily recognize areas of high buying or selling interest.
- Align with Institutional Moves: Trade alongside major market players.
- Improve Timing: Optimize your entry and exit strategies based on significant price levels.
Press enter or click to view image in full size
3. Liquidity Pools
Navigating Market Depth for Optimal Trading
Liquidity pools are areas on the chart where a large number of pending orders, both buy and sell, are clustered. These pools are critical because they provide the necessary liquidity for executing large orders without causing significant price changes.
Why They’re Important:
- Price Attraction: Markets tend to gravitate towards liquidity pools to fill pending orders, leading to predictable movements.
- Volatility Anticipation: High liquidity areas can lead to increased volatility when these zones are reached.
Spot with Our Indicator:
Our indicator helps you identify liquidity pools by highlighting these zones, allowing you to:
- Anticipate Market Moves: Predict potential price movements towards these pools.
- Manage Risk: Adjust your stop-loss and take-profit levels accordingly.
- Avoid Traps: Be wary of common pitfalls like stop hunts around these areas.
Press enter or click to view image in full size
4. Fair Value Gaps
Identifying Market Inefficiencies for Trading Opportunities
A Fair Value Gap (FVG) occurs when there’s a significant price movement in one direction with little to no trading in between — essentially a gap on the chart. These gaps represent areas where the market hasn’t traded efficiently, often leading to price retracements to “fill” the gap.
Why They’re Important:
- Market Corrections: FVGs indicate potential areas where the price might return to achieve market equilibrium.
- Trading Signals: They can serve as entry or exit points based on expected price movements to fill the gaps.
Visualize with Our Indicator:
Our indicator automatically detects and marks fair value gaps on your charts, assisting you in:
- Easy Identification: Quickly spot gaps without manual analysis.
- Strategic Planning: Use gaps to set up potential trades anticipating gap fills.
- Enhanced Analysis: Combine FVGs with other indicators for robust trading strategies.
Press enter or click to view image in full size
5. Breakers and Mitigation Blocks
Understanding Market Reversals and Continuations
Breakers are price levels where the market breaks through a previous support or resistance level, indicating a potential change in market sentiment. Mitigation blocks are areas where previous imbalances in the market are corrected, often leading to reversals or continuations.
Why They’re Important:
- Reversal Indicators: Identifying breakers can signal a shift in trend direction.
- Risk Management: Recognizing mitigation blocks allows for better placement of stop-loss orders and expectation of potential price reactions.
Leverage Our Indicator:
Our indicator provides clear signals for breakers and mitigation blocks by:
- Highlighting Key Levels: Marks areas of potential trend reversals or continuations.
- Supporting Decision Making: Offers visual cues to support your analysis.
- Enhancing Risk Management: Helps in setting protective stops and profit targets.
Press enter or click to view image in full size
6. Time and Price Theory
Synchronizing Market Movements with Optimal Timing
The Time and Price Theory suggests that significant price movements often occur at specific times, influenced by the rhythm of the market and the behavior of its participants. Aligning your trading strategies with these periods can enhance the effectiveness of your trades.
Why It’s Important:
- Optimal Entry and Exit: Timing trades during periods of expected volatility can increase the potential for profit.
- Market Predictability: Understanding time-based patterns adds another layer of analysis to price movements.
Synchronize with Our Indicator:
Our indicator aligns time and price by:
- Highlighting Key Time Frames: Indicates periods when significant market movements are likely to occur.
- Combining Time with Price Levels: Provides a comprehensive view of potential trading opportunities.
- Enhancing Strategy Development: Allows you to plan trades around times of expected activity.
7. Risk Management and Psychology
Building the Foundation for Long-Term Trading Success
Successful trading isn’t just about strategies and indicators; it’s also about managing risk and maintaining the right mindset. Risk management involves protecting your capital by controlling how much you risk on each trade. Trading psychology focuses on your emotional state and discipline while trading.
Why They’re Important:
- Capital Preservation: Ensures you can stay in the game long enough to realize profits.
- Consistency: A disciplined approach leads to more consistent results over time.
- Emotional Control: Helps in making objective decisions, avoiding mistakes driven by fear or greed.
Stay Disciplined with Our Indicator:
Our indicator supports risk management and positive trading psychology by:
- Providing Objective Data: Reduces reliance on emotional decision-making.
- Promoting Discipline: Encourages adherence to your trading plan through clear signals.
- Enhancing Confidence: Builds trust in your analysis and strategies.
Conclusion
Embarking on your trading journey requires more than just luck; it demands knowledge, strategy, and the right tools. By mastering these seven essential ICT trading concepts — Market Structure, Order Blocks, Liquidity Pools, Fair Value Gaps, Breakers and Mitigation Blocks, Time and Price Theory, and Risk Management and Psychology — you equip yourself with the insights needed to navigate the financial markets confidently.
Our specialized indicator is designed to simplify these complex concepts, providing clarity and actionable insights. It bridges the gap between understanding theory and applying it practically in your trading activities.

