Why Price Breaks Your Level — Then Reverses Immediately
 SwapHunt6 min read·Just now
--
The most painful trades are the ones where the level held — just not for you.
You drew the line. You watched it for days. Price approached, paused, and then broke through with a clean wick. You either entered the breakout or had your stop placed just on the other side. Within minutes, price reversed. The level that “broke” turned out to hold. The move you anticipated happened — in the opposite direction.
This is not bad luck. It’s not a flaw in your analysis. It’s a feature of how modern order flow operates around visible levels.
Levels Are Coordinates, Not Magnets
The first mistake is treating support and resistance as forces that act on price. They don’t. A level is just a coordinate on a chart — a price where a meaningful amount of buying or selling occurred in the past.
What gives the level its apparent power isn’t the level itself. It’s the orders that accumulate around it because traders draw it on their charts.
Stop-loss orders cluster just beyond support, because that’s where the technical thesis is invalidated. Breakout entries cluster just beyond resistance, because that’s where the move is “confirmed.” Limit orders to fade the break sit a bit further out, placed by traders who expect the cluster to be hunted.
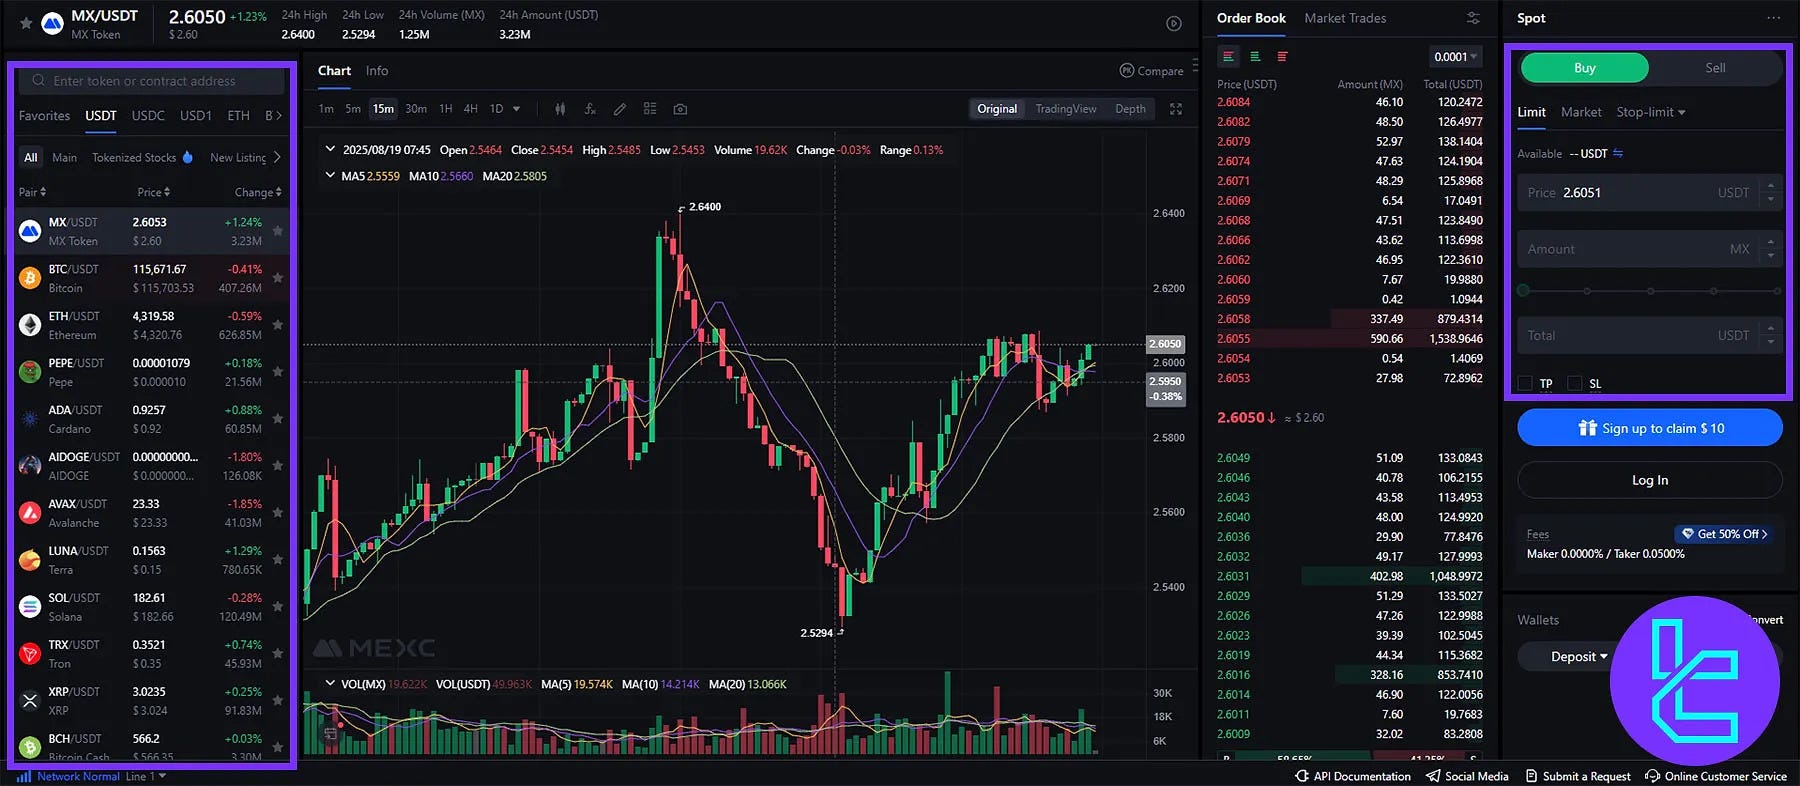
The level itself is inert. The orders around it are not. And those orders are visible — not necessarily by name, but in aggregate. Anyone watching the order book or the heat map can see where the resting volume sits.
That visibility is the entire problem.
The Liquidity Mechanic
Large participants don’t enter positions by clicking buy at market. Doing so moves price against them before they’re filled. The larger the intended position, the worse the slippage.
What they need is opposing liquidity — counterparties willing to sell to them at predictable prices. The cluster of stops just below support is exactly that. When those stops trigger, they become market sell orders. The large buyer absorbs that selling at a price they could not have achieved by entering passively.
This is the actual function of the wick. Price doesn’t need to break the level to reverse. It needs to break the level just enough to convert resting stop-losses into market orders. The depth of the break is proportional to the size of the stop cluster, not the strength of the move.
Once the cluster is consumed, the buying pressure that would otherwise have shown up at the level returns, often with the inventory of the large participant added on top. Price reverses. The wick prints. The chart now shows a level that “held” — but only after sweeping the traders positioned around it.
The Difference That Most Traders Miss
The reason this mechanic works so consistently is that most traders cannot distinguish a sweep from a real break in real time. Both look the same in the first few minutes. A red candle. Volume. Price below the line.
This is where the difference between a retracement and a reversal becomes structurally important — and why most “breakouts” are neither. A real break extends. The first candle below the level is followed by continuation, not reclaim. Volume sustains, not spikes-and-fades. The market structure on the next higher timeframe shifts.
A sweep does none of those things. The candle prints, the wick fills, and within one or two candles, price is back above the level. The break wasn’t a break. It was an inventory event.
But in the moment, you don’t know which one you’re watching. The candle is still forming. The next candle hasn’t arrived. The decision pressure peaks exactly when the information is least available.
Why the Wick Is the Trade
For the participant who designed the sweep, the wick isn’t a side effect. It’s the entire trade.
They are not waiting for confirmation. They are not entering on the break. They are absorbing the liquidity created by the break and positioning in the opposite direction. By the time you see the wick on the chart, their position is already on. The reversal you’re about to witness is them collecting their fill.
This inverts how most traders think about the candle. You see the wick as evidence of rejection. They placed the wick as their entry mechanism. Same candle, opposite meaning.
This is why the wick “always happens” at the level you drew. The level you drew is also the level they targeted. The cluster of orders that made the level feel real to you is the same cluster that made it useful to them.
The Behavioral Layer
The mechanical sweep is only half the story. The other half is what the sweep does to the trader who was hit by it.
A stop-out at a swept level isn’t just a financial event. It’s a confidence event. The level was right. The analysis was right. The thesis was right. The only thing that was wrong was the placement of the stop — and that’s the part the trader was told to do.
So the next time, the trader places the stop further out. Or moves it once price gets close. Or removes it entirely “to avoid the wick.” Each of these adjustments is a rational response to a recent painful experience. Each one is also a structural error.
This is why traders break their own rules — the wick triggers behavior that wouldn’t survive a calm review on a Sunday afternoon. The trader who would never widen stops in theory does it routinely in practice, because the alternative — getting wicked again — feels intolerable.
The result is a worse system applied with more discipline. The original rules were defensible. The revised rules are reactive. The trader has solved for the last loss instead of the next one.
The Asymmetry of Information at Levels
When price approaches a watched level, the information available to different participants is wildly uneven.
The retail trader sees price, volume, and indicators. The market maker sees the order book, the imbalance between bid and ask, and the depth of resting orders on each side. The large directional participant sees the aggregate exposure across venues — including funding rates, open interest distribution, and the leverage clusters that map to specific price ranges.
At a quiet level, this asymmetry is irrelevant. Price drifts. Nothing fires. Everyone watches.
At a contested level, the asymmetry becomes the trade. The participants with visibility into the order structure act first. The participants without that visibility react after the fact. The reaction is the liquidity the first group needed.
The retail trader is not being targeted personally. They are simply on the wrong side of an information gap that becomes financially significant at exactly the moment they expect to act.
What Changes If You Accept the Mechanic
Most of the changes that protect against this dynamic aren’t analytical. They’re structural.
Stops placed at the obvious technical level have the highest probability of being swept. Stops placed at structurally meaningless prices — slightly inside the level, or anchored to invalidation criteria rather than chart coordinates — survive sweeps more often.
Entries taken on the break itself are the most exposed. Entries taken on the reclaim, after the sweep has resolved one way or the other, accept worse pricing in exchange for higher signal quality. The reclaim is the information the break never provided.
Position sizes calibrated to the average move underestimate the risk at contested levels. Sizing for the sweep — assuming the wick will exceed your stop by some margin — produces smaller positions that survive the events the chart didn’t warn you about.
None of this requires new tools. It requires recognizing that the level you drew is also a coordinate someone else is targeting, and the orders you placed at that coordinate are the reason their trade works.
The Quiet Observation
The most uncomfortable realization in technical analysis is that the more obvious a level is, the more contested it becomes. The cleaner the chart pattern, the more visible the orders. The more visible the orders, the more attractive the sweep.
This doesn’t make levels useless. It makes them tools that require more care than the textbooks suggest. The level is real. The price reaction at the level is real. The trade that fades the break is real.
What isn’t real is the assumption that the break itself is the signal. The break is the bait. The signal is what happens after the bait is taken.
You stop trading the line. You start trading the reaction to the line. The chart doesn’t change. Your relationship to the candle does.
Continue reading
More from SwapHunt:
- Retracement vs Reversal: The Difference — How to read the move that follows the wick.
- Why Traders Break Their Own Rules — The structure behind self-imposed structure collapse.
- Silence Before the Storm — Why compression always precedes the sweep.
Free download: Why the Trades You Don’t Take Matter More — On restraint and the unmade trades.
Follow @SwapHunt for daily observations.
This content is for educational purposes only. Not financial advice.