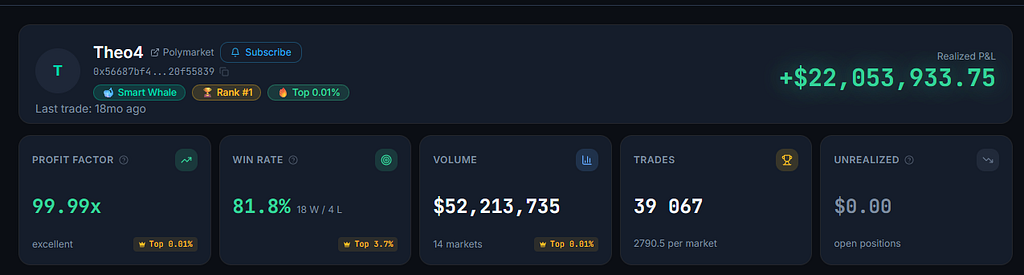
You open a Polymarket whale tracker. A wallet sits at the top of the leaderboard with 99% win rate over 1,400 resolved markets. Beside it, “lifetime P&L: +$8,200.”
You stop scrolling. Take a second look. Ninety-nine percent? That can’t be real. And then maybe — for half a second — you wonder if you should copy this wallet. Because if it really wins 99% of the time, you’d be a fool not to.
Don’t.
That win rate is real in the strict sense — the wallet did close 1,386 of 1,400 markets in the green. But it’s not skill, it’s not insight, and it’s certainly not something you can copy. It’s an artifact of how Polymarket’s order book is structured, layered on top of a token-incentive farming pattern that only looks like trading. We index 470 million trades from the Polymarket Polygon contract and we see this pattern thousands of times — at the very top of every naive leaderboard.
This piece walks through the four mechanics that produce phantom 99% win rates, and shows what real smart money actually looks like in our data.
The four ways a 99% win rate is manufactured
1. Farming the certain side of markets
Consider the market “Will Bitcoin be above $1 on December 31, 2026?” The YES side is trading at 0.99. There is no reasonable scenario in which this resolves NO — Bitcoin would need to lose 99% of its value in a few weeks.
A wallet can buy YES tokens for $0.99 each, hold them for two days, and almost certainly collect $1.00 on resolution. That’s a 1% return per market. Net of gas and slippage, the wallet earns a few dollars. But the win rate column on the tracker increments by one.
Repeat this 1,400 times across markets that are essentially decided already, and the wallet now has a 99% win rate on the leaderboard. The total profit might be less than $10,000 spread over months — sometimes deliberately incentivized by Polymarket’s volume-rewards programs that pay liquidity providers in tokens. The wallet isn’t predicting anything. It’s grinding near-certainties for token rewards while the leaderboard interprets each microscopic win as a “correct call.”
We flag these wallets as farmers. They share three signatures:
- Average entry price above 0.85 or below 0.15 (always taking the heavily-favored side)
- Per-market profit under $50 in absolute terms
- Trade frequency far above what a discretionary trader could maintain
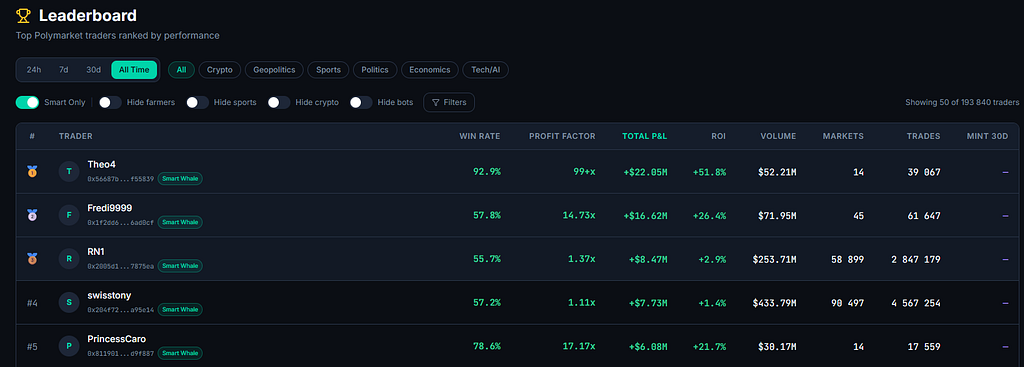
Among the 171,000 wallets in our smart-whale index, roughly 38% would qualify as “smart” by raw win rate alone — but only 22% pass the farmer filter. The other 16% are this exact pattern: tiny wins on certain markets.
2. NegRisk multi-market double-counting
This one is technical but worth understanding because it’s the single biggest source of inflated win rates we see.
Polymarket has multi-outcome markets — “Who will win the 2028 GOP nomination?” with maybe 10 candidates. Behind the scenes, these are implemented as a NegRisk adapter that spawns multiple binary YES/NO sister markets, one per outcome. If you bet “Trump YES” at 0.40, your position is technically two correlated tokens: a YES on the Trump-specific binary, and an indirectly-linked stake in the broader event.
When the event resolves and Trump wins, the YES token pays out. But on naive trackers, the wallet’s resolved-markets counter increments multiple times — once for the Trump-specific market, once for each of the related sister markets that resolve at the same moment. Because the wallet won the Trump bet, those linked resolutions all count as wins too, even though they’re really just accounting reflections of one underlying call.
A trader who makes ten correct multi-outcome calls can show up with forty or fifty winning resolutions — and suddenly the “win rate” column reads 95%+ for what was really a small number of independent decisions.
OrcaLayer halves the effective USD volume on NegRisk positions and consolidates resolution events back to the underlying decision. After that adjustment, the same trader’s true win rate is closer to 63–71% — high, but not the surreal number the naive tracker showed.
3. Lifetime P&L hides behind a per-market average
The ratio that matters isn’t win rate. It’s profit per trade, multiplied by trades per year, integrated over a long enough sample to average out variance. A 99% WR trader making $7 per trade is materially worse than a 60% WR trader who closes positions averaging $4,000 P&L each.
In our index of all wallets that have closed at least 50 markets:
The 99th-percentile smart whale sits in the 70–80% win rate range. They take fewer, larger positions and are fine being wrong 25–30% of the time because the average winner pays for two losers and lunch.
When a tracker dangles 99% WR in front of you, it almost always comes with a microscopic average trade size. We require $200K+ lifetime P&L over at least 10 resolved markets before a wallet is even eligible to be flagged as smart in our system. That single filter knocks out ~96% of the leaderboard, including all the farming wallets and most of the NegRisk artifacts.
4. Win rate doesn’t price the trade
A wallet that bought “Trump wins 2024” at $0.98 in October 2024 was not making a brilliant prediction. They were buying a near-certain payoff at a near-certain price. Adding that resolution to a win-rate column over-credits a position that any random observer could have taken.
Compare that to a wallet that bought “Trump wins 2024” at $0.32 in February 2024. That wallet was making a prediction — taking conviction at a contested price, before the market had clarified. Both wallets won the same market. Both increment win-rate identically. But only one has demonstrated edge.
Real smart-money trackers weight by entry price relative to settlement — if you bought at 0.32 and resolved at 1.00, that’s a +213% return. If you bought at 0.98 and resolved at 1.00, that’s +2%. Same “win,” very different signal.
What real smart money looks like in our data
Among the 171,000 wallets we track, 12,000 are flagged smart after farmer-filter and NegRisk adjustments. The top 100 of those have these characteristics:
- Win rate: 65–72% (not 99%)
- Resolved markets: 80–300 (not 1,400)
- Lifetime P&L: $500K to $35M
- Average position size: $1,800 to $40,000
- Holding period: median 18 days (range: 2 hours to 6 months)
The single largest profitable wallet in our dataset has won approximately 67% of resolved markets and pulled out $11.4M in lifetime profit. They have lost 33% of their positions, sometimes painfully, but their average winner is 2.4× the size of their average loser. That’s the signal. Not winning every time — sizing correctly when you do.
If a tracker shows you 99% across thousands of markets, look at three things before believing the number:
- What was the average $ per trade? Under $100 means it’s farming or NegRisk artifact.
- How long is the holding period? Under 24 hours on resolved-imminent markets means farming.
- What’s the lifetime P&L? Under $50K means win rate is statistically meaningless regardless of percentage.
How we calculate our numbers
Our 7.9% retail win rate and 67% smart-whale win rate aren’t taken from a Polymarket dashboard. They’re computed from raw on-chain data:
- Source: 470M trades indexed from the Polygon CTF contract since 2024
- Sample: every wallet that has closed at least 10 resolved markets
- Metric: number of profitable resolved markets / total resolved markets, weighted by side-level outcome (each outcome is a separate FIFO accounting unit, so a wallet that bought YES at 0.40 and held to 0.95 is 1 win regardless of how many sub-trades it took)
- Adjustments: NegRisk multi-market positions are consolidated; farmer wallets filtered; bot-flagged wallets excluded
The full methodology, including how we derive lifetime P&L from on-chain settlement data instead of Polymarket’s reported numbers, is documented in our API docs. We also cross-validate our P&L against Polymarket’s lb-api when available — agreement is within 0.7% on average across the top 5,000 wallets.
What to do with this
Two practical takeaways:
1. Stop copying high-WR wallets. A 99%+ win rate is almost always a farming or NegRisk signature. The wallets that have made real money on Polymarket sit at 65–72% — and those are the ones worth following.
2. Use win rate alongside P&L and trade size. A trader winning 67% of $5,000 trades is a different animal from a trader winning 99% of $50 trades. Both are real, only one is informative.
The ladder of trader skill on Polymarket is steep, and the leaderboard’s top is full of mirages. Real edge looks ordinary on the surface — moderate win rate, moderate trade frequency, big absolute P&L. The 99% wallet you wanted to copy is doing something you couldn’t replicate, even if you tried, because it’s not really trading.
Search any Polymarket address on orcalayer.com and we’ll show you the raw on-chain numbers without the inflation. Compare what we report to what the dashboard your tracker showed you and decide for yourself.
Originally published at https://orcalayer.com on May 8, 2026.
Why a 99% Win Rate on Polymarket trackers is a trap was originally published in Coinmonks on Medium, where people are continuing the conversation by highlighting and responding to this story.