Member-only story
When the Numbers Look Good But the Edge Isn’t There: A Case Study in BMY
A walk through simple backtesting, parameter sensitivity, and walk-forward validation — and what happens when all 3 tell you the same uncomfortable truth.
 Kryptera13 min read·Just now
--
The Setup
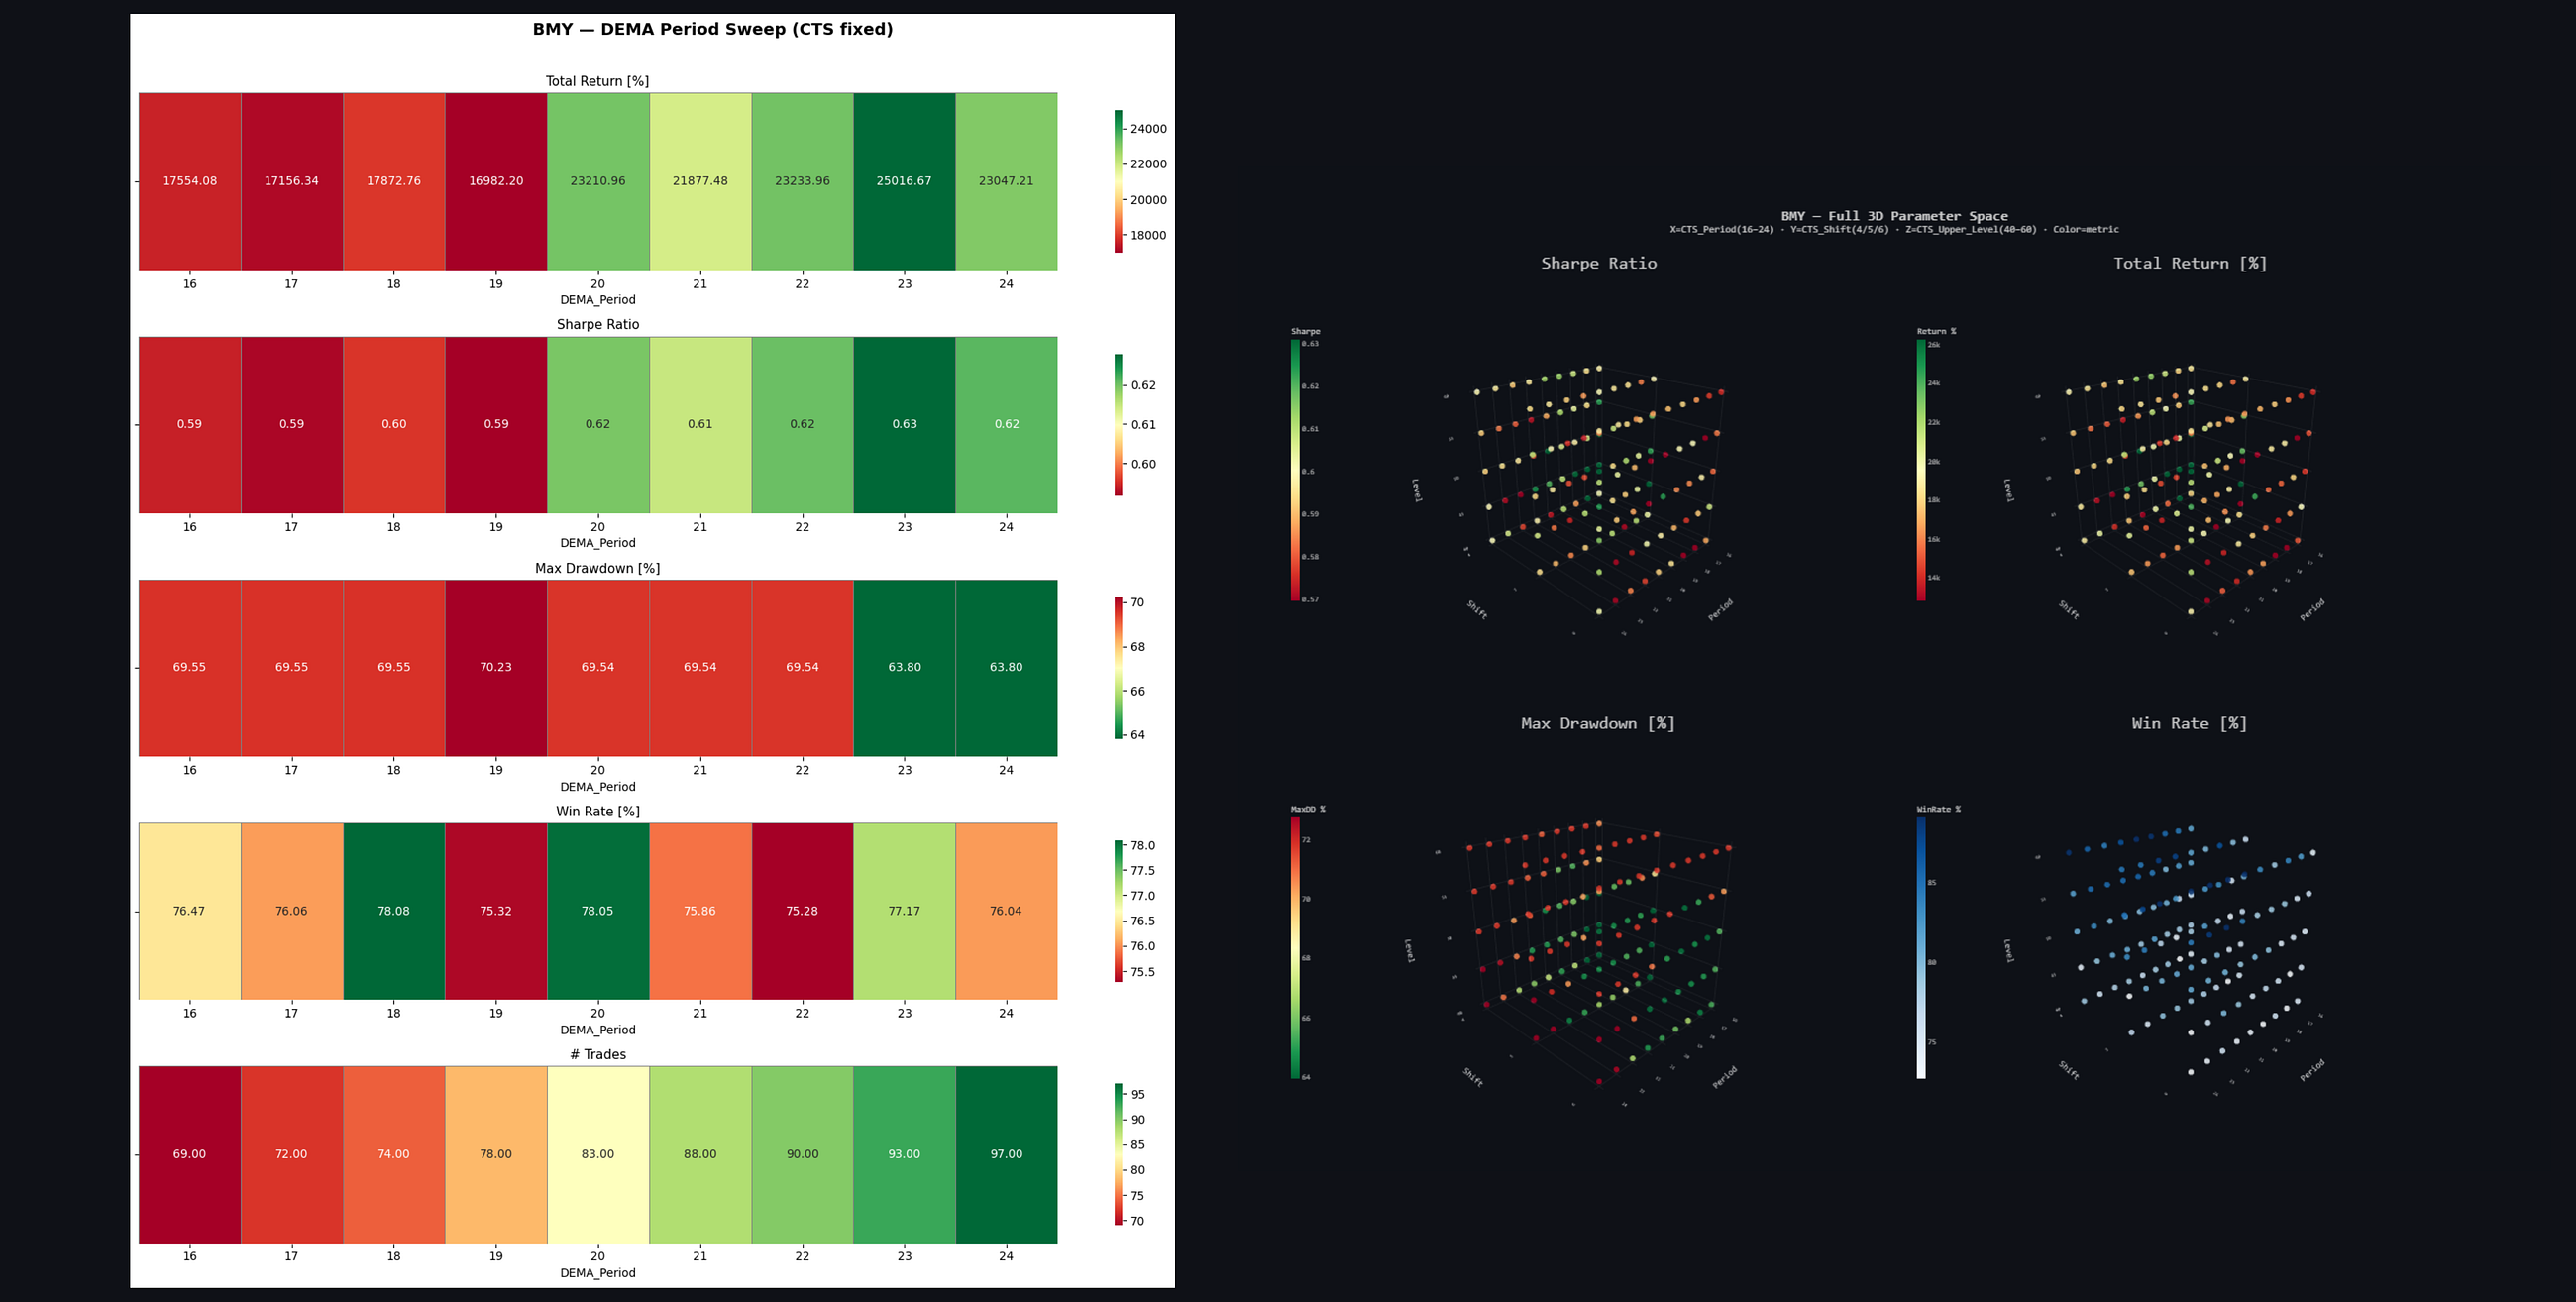
Every strategy starts with an idea. This one is straightforward: buy Bristol-Myers Squibb (BMY) when price falls below its Double Exponential Moving Average (DEMA) — a momentum-filtered trend signal — and exit when the Commodity Channel Strength (CTS) indicator crosses back below an upper threshold after being overbought. Entry on weakness, exit on exhaustion.
2 indicators. 4 parameters. Simple logic.
Entry:  Close < DEMA(period)
Exit:   CTS(period, shift) crosses below upper_level
The backtest runs on daily data from 1976 to 2026 — fifty years of BMY price history. Fees at 0.1%, slippage at 0.2%. Realistic enough.
Stage 1: The Simple Backtest
import pandas as pd
import numpy as np
import yfinance as yf
import vectorbt as vbt

# -------------------------
# Download Data
# -------------------------

symbol = "BMY"
start_date = "1976-01-01"
end_date = "2030-01-01"
interval = "1d"

df =…