When the AI Keeps Cheering While the Market Keeps Falling
--
An ordinary investor’s frustration with narratives that never seemed to match reality.
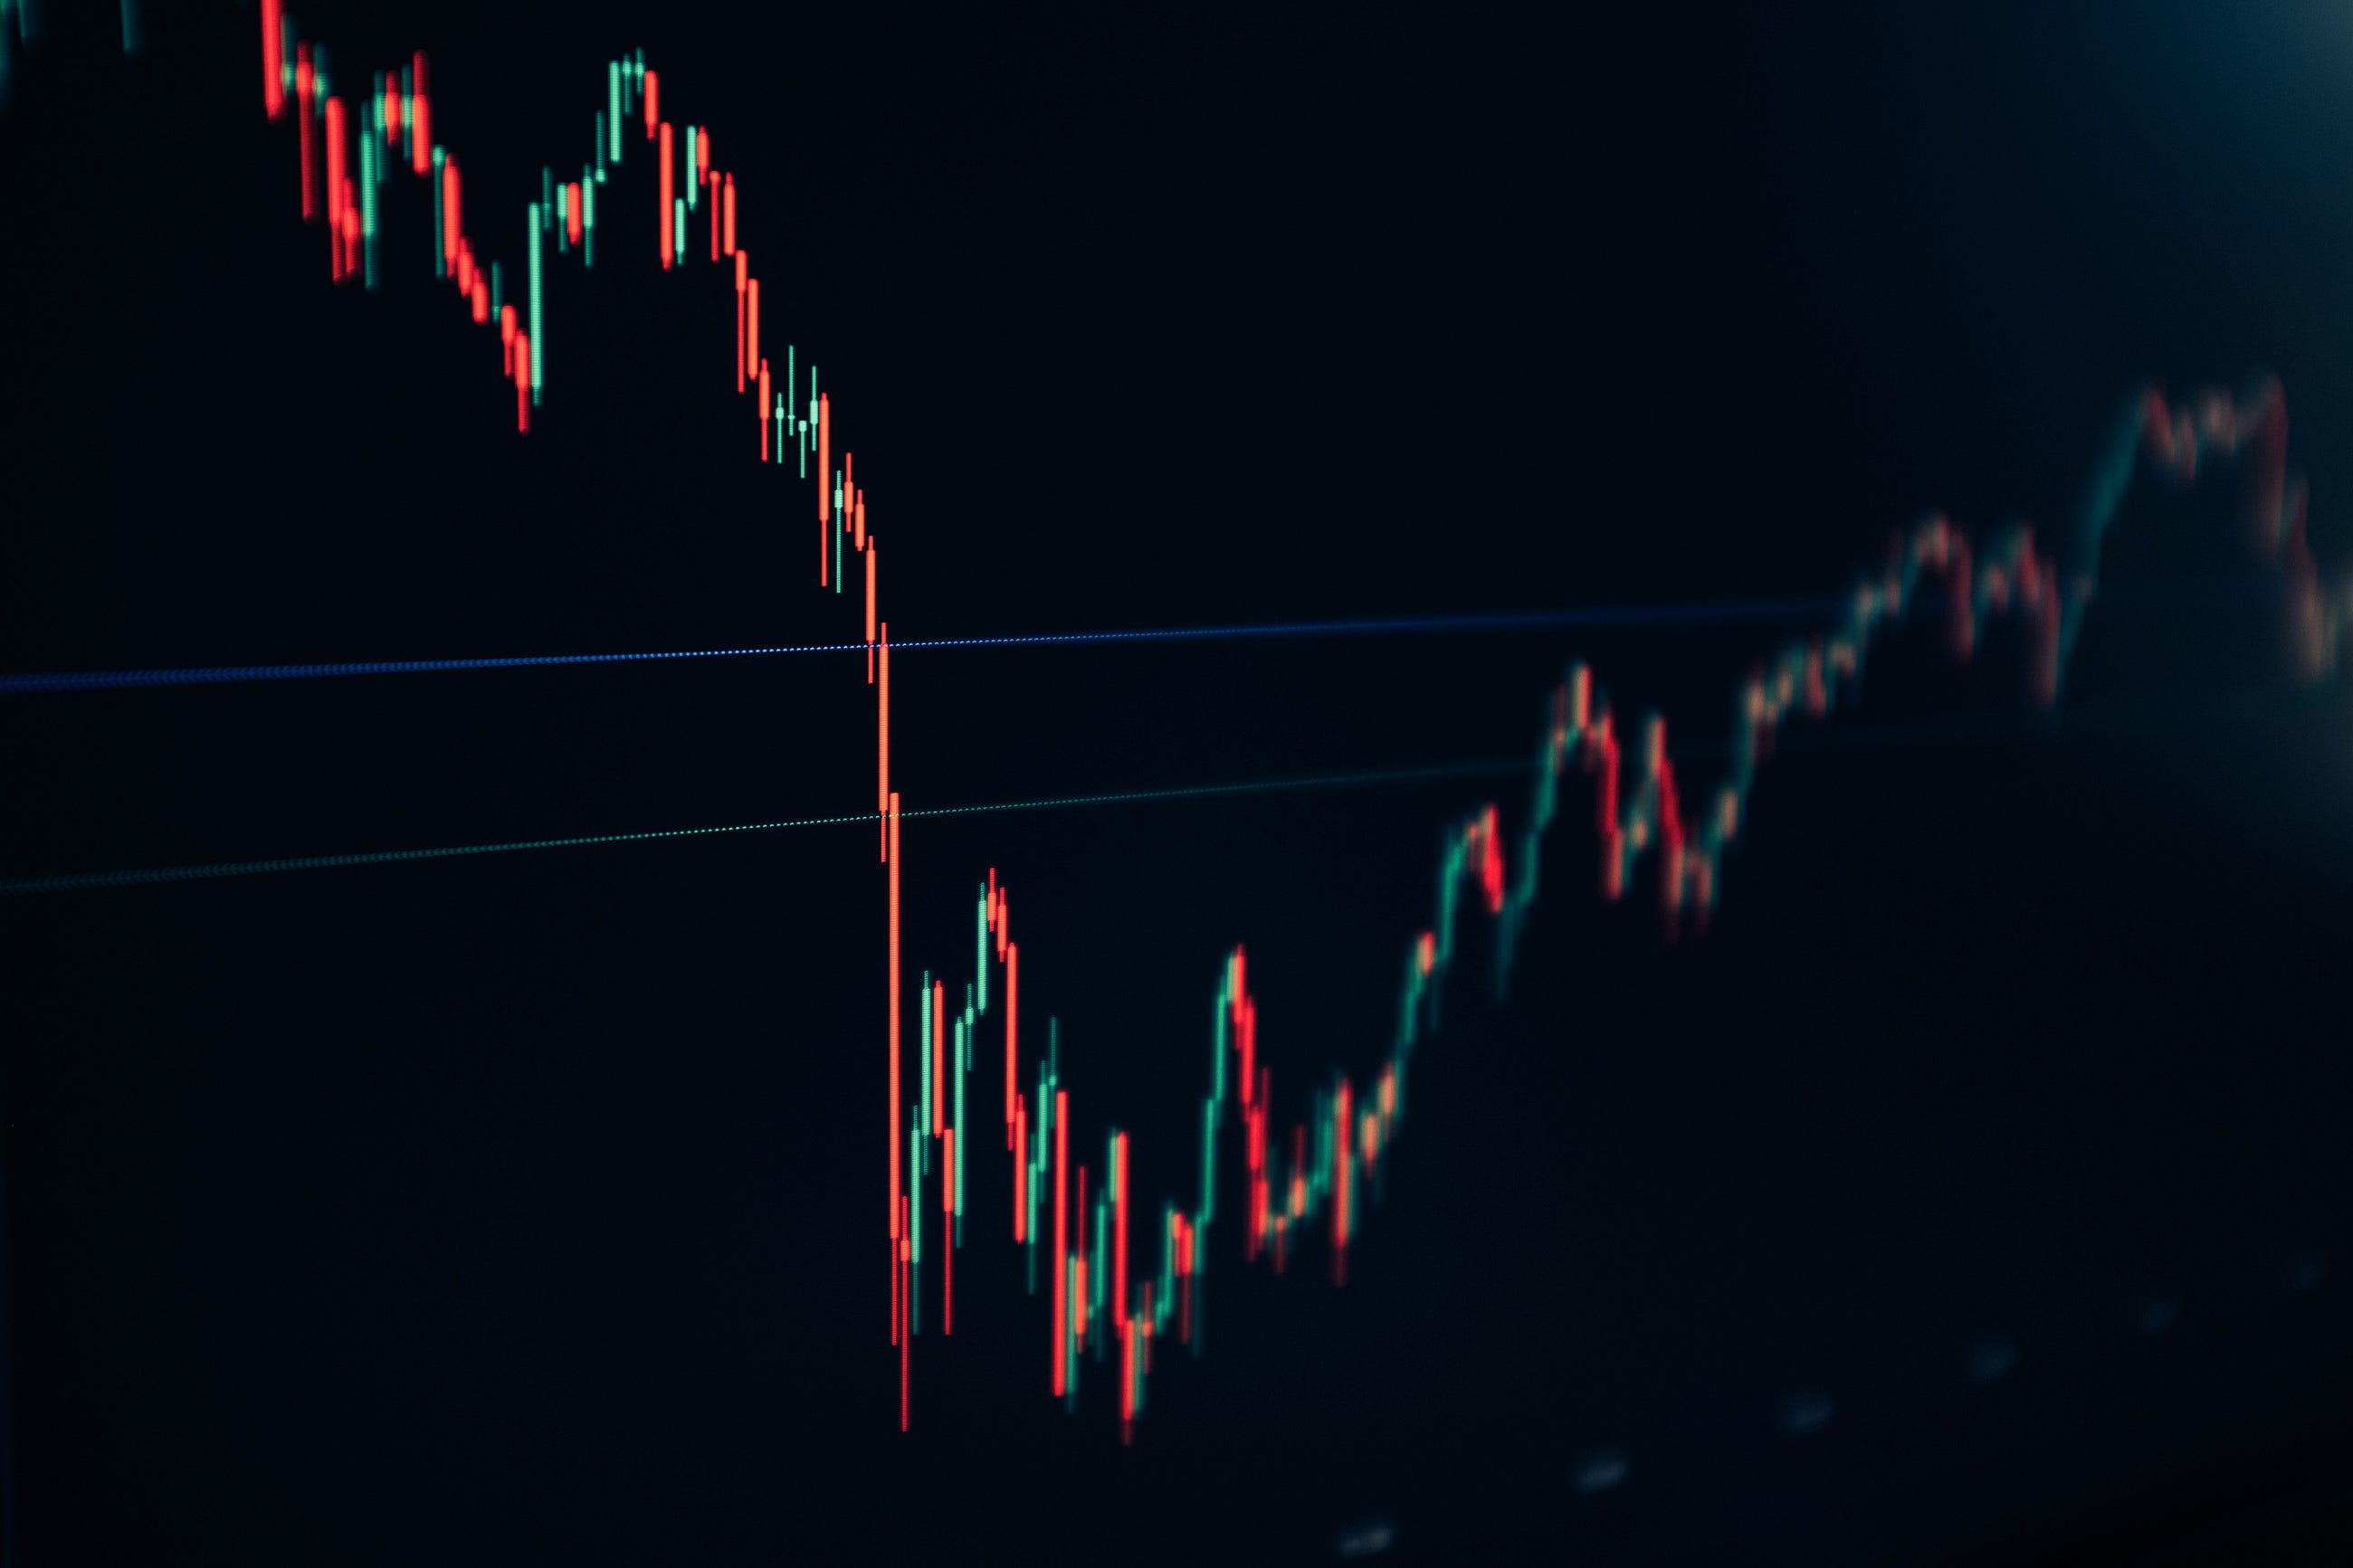
For the last couple of months, I’ve had a routine. Wake up, grab coffee, open Bitcoin, look at the chart, read the exchange AI summary, and then scratch my head wondering if we were looking at the same damn market.
The chart would be struggling. The chart would be testing support. The chart would be failing to reclaim resistance. Yet the AI would tell me about resilience.
That word started driving me nuts.
Not because Bitcoin can’t be resilient. Not because resilience isn’t real. But because every day seemed to bring another reason why everything was supposedly okay. If Bitcoin lost a level, it was healthy. If Bitcoin got rejected, it was constructive. If Bitcoin moved sideways, it was building a foundation. If Bitcoin sold off, it was absorbing pressure.
No matter what happened, there always seemed to be a positive spin attached to it.
Eventually I stopped asking where Bitcoin was going and started asking why the explanations always seemed to point in the same direction.
I wasn’t looking for doom and gloom. I wasn’t looking for somebody to tell me Bitcoin was dead. I was looking for somebody to simply describe what was happening.
Instead, it felt like I was reading the financial version of a football coach giving a locker room speech after losing three games in a row.
“We’re making progress.”
“We’re seeing improvement.”
“The fundamentals are there.”
Meanwhile the scoreboard keeps getting worse.
The thing that really started bothering me was support. Every level was support until it wasn’t. Then the next level became support until it wasn’t. Then the next level became support until it wasn’t.
At some point I started asking a simple question:
At what point does a support test become a support failure?
Because there is a difference. A huge difference.
If Bitcoin keeps revisiting a level over and over, eventually that isn’t strength anymore. It’s a warning.
Yet almost every summary seemed determined to assume the support would hold until after it didn’t. Then we would move on to discussing the next support. Then the next one. Then the next one.
For months I kept hearing about accumulation.
Whales are accumulating.
Institutions are accumulating.
ETFs are accumulating.
Smart money is accumulating.
Okay. Maybe they are.
But eventually accumulation should look like accumulation.
At some point buying pressure should overpower selling pressure. At some point support should become expansion. At some point the market should stop acting weak.
That was my frustration.
I wasn’t questioning whether accumulation existed. I was questioning why the market wasn’t behaving like it mattered.
Then there was volume.
Volume would surge. Price wouldn’t.
Volume would increase dramatically. Price would barely move.
The summaries would celebrate volume while completely ignoring the obvious question.
If all this buying is happening, why isn’t price responding?
My observation was simple:
Volume up.
Price flat.
Somebody is absorbing somebody.
That seemed worth discussing.
Instead, it often felt like the conversation skipped straight to the bullish conclusion.
The longer I watched, the more I began wondering if something else was happening.
Not manipulation.
Not conspiracy.
Just a market that might be changing.
A market increasingly influenced by algorithms, ETFs, automated execution, systematic trading, and liquidity programs.
The market started feeling less like people trading with people and more like systems trading against systems.
Not because anybody planned it.
Because technology evolves. Markets evolve. Participants evolve.
The part that really got my attention was retail.
Everyone kept talking about retail buying opportunities. Retail accumulation. Retail optimism.
But where was it?
Honestly, I wasn’t seeing much evidence of it.
What I was seeing was exhaustion.
People weren’t necessarily bearish. They were tired.
There is a difference.
A bearish person sells.
A tired person walks away.
A tired person sits in cash.
A tired person buys bonds.
A tired person waits.
A tired person stops believing every breakout headline.
How many times can somebody hear “this is the move” before they stop listening?
How many times can somebody buy $78,000, $80,000, or $82,000 and watch it fail before they decide to sit on the sidelines?
Those questions never seemed to make it into the summaries.
Then Bitcoin started falling hard.
The move from the mid-$70,000s into the low-$60,000s changed everything.
Suddenly the language shifted.
Now we were talking about liquidations. Capitulation. Fear. Bear market indicators. Forced selling.
Interesting.
The market hadn’t changed overnight. The chart had been warning for weeks.
The difference was that reality had finally become impossible to explain away with optimistic language.
And that was when I realized my frustration wasn’t really with Bitcoin.
It was with interpretation.
The chart was asking questions.
The AI seemed determined to provide reassurance.
The chart was saying:
“Something is happening.”
The AI kept saying:
“Everything is fine.”
Until eventually it couldn’t anymore.
I still don’t know exactly what’s happening.
In fact, one of the things I’ve repeated over and over during this entire process is that I don’t know what the hell I’m doing.
I don’t know if this is a confidence event. I don’t know if this is a liquidity event. I don’t know if this is a participation event. I don’t know if this is a structural shift. I don’t know if it is all of those things at the same time.
What I do know is that uncertainty is a valid answer.
Sometimes the most honest thing anyone can say is:
“I don’t know.”
What bothered me wasn’t uncertainty.
It was the apparent unwillingness to admit uncertainty.
The repeated need to frame weakness as strength.
The repeated need to find a bullish explanation for every bearish outcome.
The repeated need to reassure when maybe the better answer was simply:
“We’re not sure.”
The chart gets the final vote.
Not the analyst.
Not the influencer.
Not the ETF manager.
Not the AI.
The chart.
And for the last two months, the chart and the interpretation often seemed to be telling two very different stories.
That is the question I still can’t stop thinking about.
Were we describing what the market was actually doing?
Or were we describing what we hoped it was doing?
Because those are not the same thing.
And for a while there, the difference was costing people real money.