In this project, I analyzed the financial performance of a fictional e-commerce company operating on a drop-shipping model.
Note: This is a portfolio project based on simulated data created for analytical practice.
The goal was to:
Understand why profits had stopped growing, even though sales were increasing.
The company sells three products (Product 1, Product 2, and Product 3), and revenue is generated entirely through product sales. Costs include cost of goods sold (COGS), marketing, labor, overhead, interest, and amortization.
My objective was to analyze performance across 2024 and 2025 and propose data-driven recommendations for 2026.
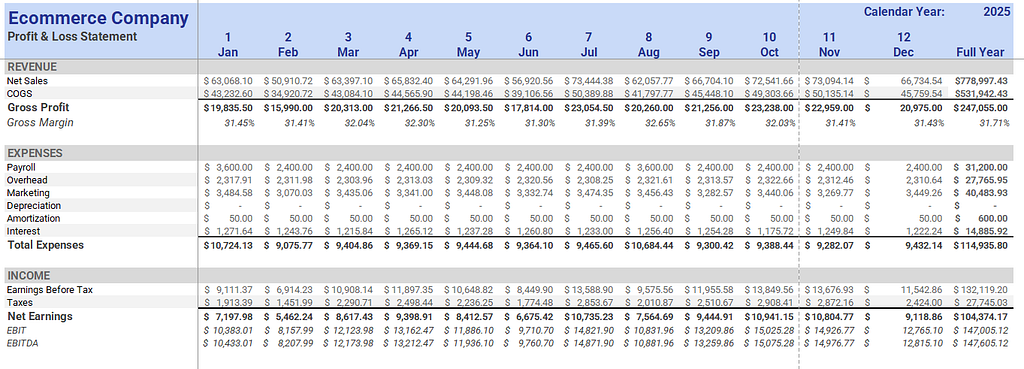
Financial Overview: 2025 vs 2024
At a high level, 2025 showed revenue growth:
- Net Sales increased from $716,765 → $778,997
- That represents roughly 8.7% year-over-year growth
However, in 2025:
- Gross Margin declined from 33.9% → 31.7%
- Marketing spend increased by 10.6%
- Net earnings remained almost unchanged (~$104k in both years)

Vs
The data shows that while revenue increased, cost of goods sold grew faster (approximately 12.3%). As a result, gross margin narrowed.
From a profit perspective, this matters more than revenue growth alone.
A business can grow sales and still struggle to improve earnings if margins compress.
Operating Metrics: EBIT & EBITDA
Next, I looked at EBIT and EBITDA to understand whether the company’s overall cost structure had changed.
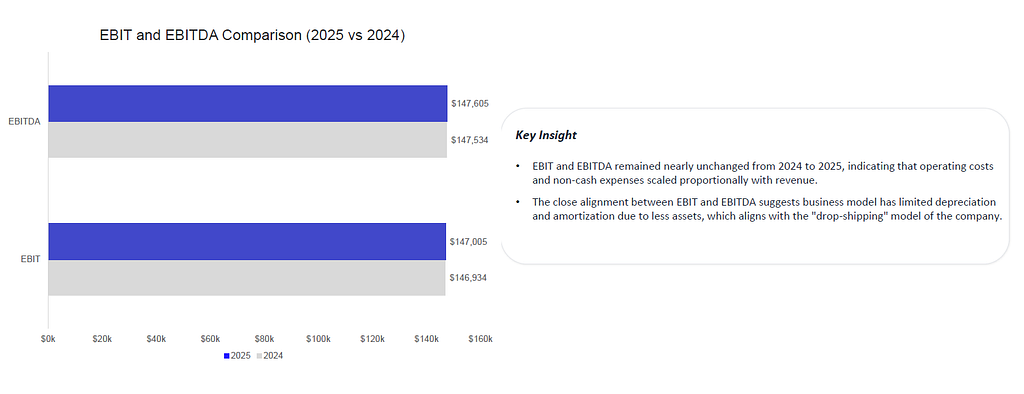
Both metrics remained almost unchanged from 2024 to 2025.
Since EBIT (operating profit) and EBITDA (profit before non-cash costs) stayed stable, this suggests that the company’s core operating expenses did not change significantly year over year.
So if operating costs were relatively stable, but net earnings did not meaningfully increase, the explanation was elsewhere.
Looking back at the data:
- Gross margin declined from 33.9% to 31.7%.
- Cost of goods sold grew faster than revenue.
- Product-level profitability shifted across the three products.
When costs rise faster than sales, each dollar of revenue generates less profit. At the same time, changes in which products are driving sales can affect overall earnings, since not all products contribute equally to profit.
Taken together, this suggests that the slowdown in profit growth was more closely related to margin pressure and product mix rather than structural changes in the company’s operating expenses.
Product-Level Analysis
To understand where profits were changing, I analyzed each product separately.
Units Sold
Total units sold increased from 58,953 in 2024 to 64,757 in 2025.

However, the growth was not evenly distributed.
- Product 3 accounted for most of the increase
- Product 1 grew moderately
- Product 2 declined
Profit by Product
To measure profitability more clearly, I calculated the average daily profit for each product.

Here’s what changed from 2024 to 2025:
- Product 1 improved by +$48.50 per day
- Product 2 declined by −$22.24 per day
- Product 3 remained strong, but slightly lower than the prior year
When broken down by month:

- Average monthly profit trends varied by product. Product 1 consistently outperformed in 2025 (except slight dip in May-Jun), indicating stronger margins.
- Product 2 experienced declining and frequently negative average monthly profits in 2025, suggesting ongoing cost or revenue challenges.
- Product 3 remained the most profitable product overall monthly, though it exhibited fluctuating demand or variable expenses.
Overall, profitability trends varied meaningfully by product, indicating that performance changes were driven by product-specific dynamics rather than company-wide factors.
Recommendations for 2026
Based on this analysis, I proposed three practical actions.
1️⃣ Protect Gross Margins
Since gross margin declined:
- Renegotiate supplier pricing for Products 1 and 3
- Consider selective price increase for high-demand item like Product 3
The goal is to ensure that increased sales translate into stronger profit per unit.
2️⃣ Reassess Product 2
Product 2 shows declining units and negative average daily profit in 2025. Therefore:
- Reduce or pause marketing spend on Product 2
- Conduct a deeper cost review of this product
- Evaluate pricing, repositioning, or discontinuation of Product 2
3️⃣ Improve Marketing Efficiency
Marketing spend increased, but earnings did not meaningfully rise:
- Allocate more marketing spend toward Products 1 and 3
- Test bundling Product 3 with Product 1 to lift margins
- Run AB tests on offering Product 1 as a premium offering
- Reduce spend during low-margin months
The objective is to align marketing investment with products that generate stronger returns.
Final Reflection
This portfolio project helped reflect on some important financial ideas-
Profit depends not only on how much is sold, but:
-Which products drive sales
-How strong margins are
-How effectively costs are managed
Sustainable performance requires alignment between pricing, product mix, and cost control.
You can explore the full project on GitHub here: https://github.com/pratiti-soumya/Business-Analytics-with-Excel
Visit my Portfolio: https://www.datascienceportfol.io/prati
When Sales Grow but Profits Stall: A Profitability Analysis was originally published in DataDrivenInvestor on Medium, where people are continuing the conversation by highlighting and responding to this story.