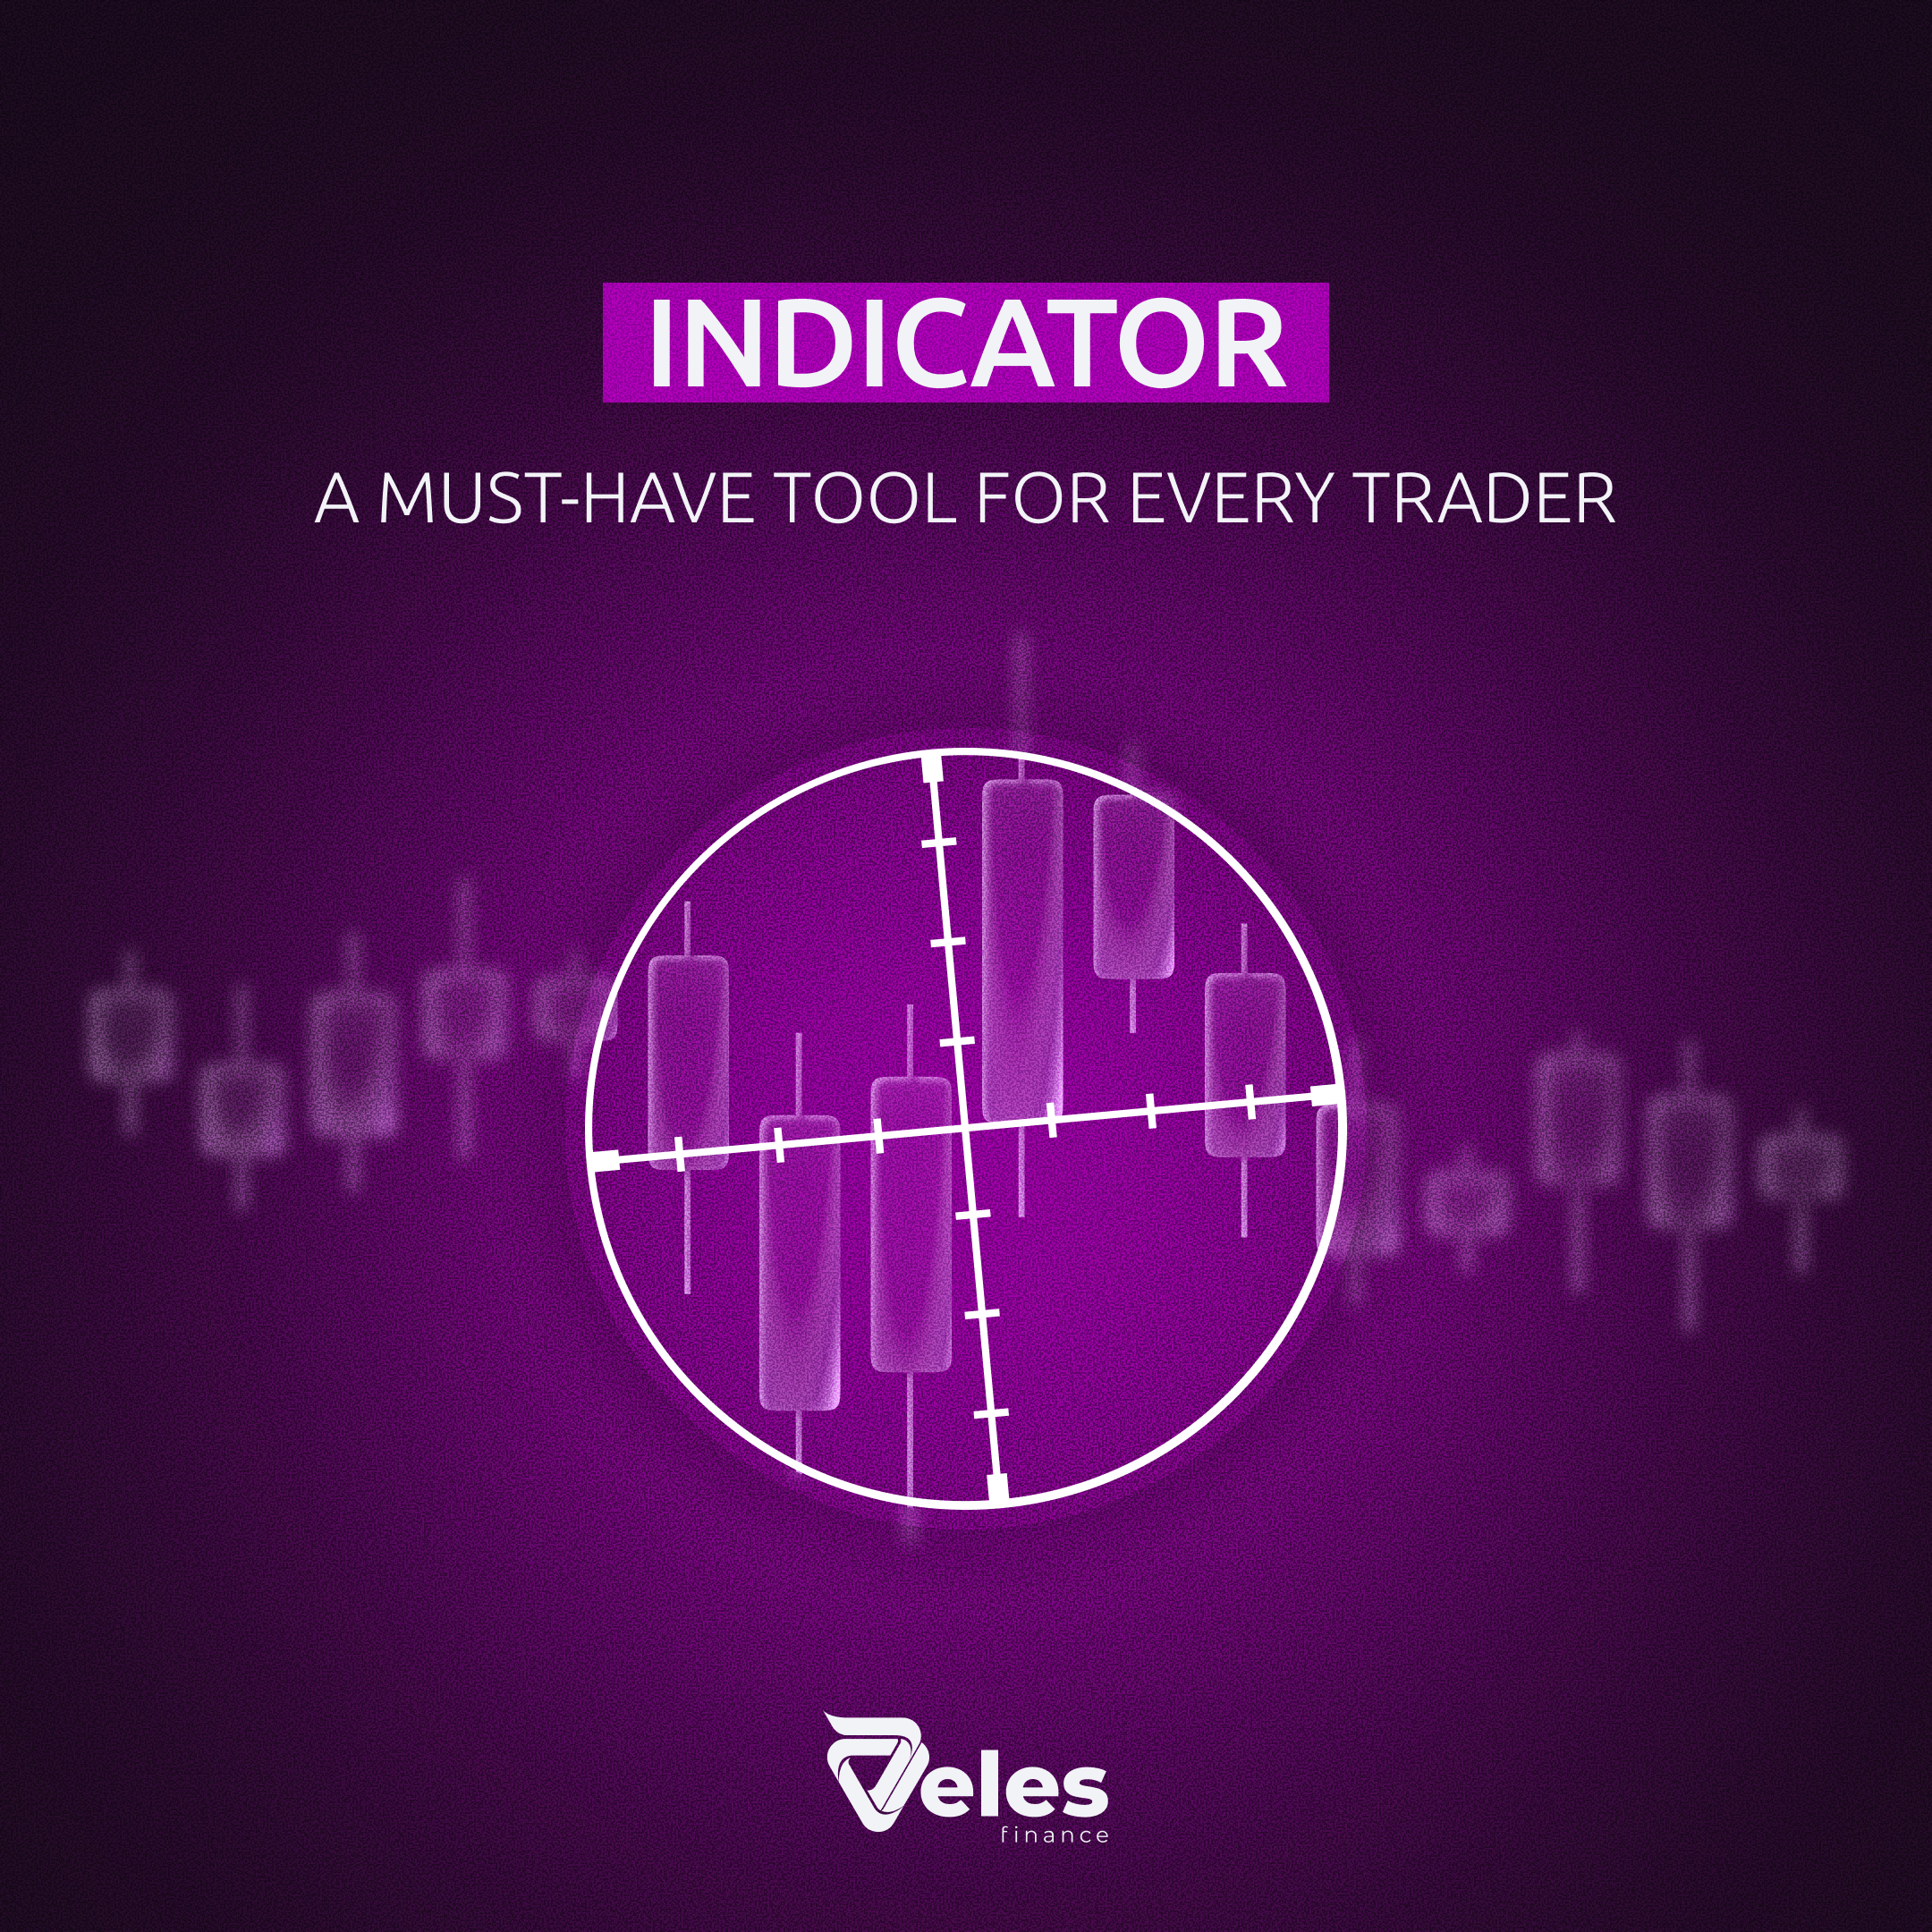
What is an indicator and what is it for?
 Veles2 min read·1 hour ago
--
On a chart, price moves chaotically — spotting patterns and finding a good entry point by eye is nearly impossible. That’s exactly what indicators are for. Let’s break it down in detail…
An indicator is a specialized tool that helps analyze the market and make forecasts about possible price movements.
Its job is to help a trader see hidden patterns, assess market conditions, and understand when it’s better to buy or sell an asset.
For example: you’re looking at a BTC chart and can’t tell — is this a correction or a trend reversal? RSI shows a value of 28 — the oversold zone. This isn’t a guarantee of growth, but it’s a signal that sellers are running out of steam and it’s worth considering a buy
What types of indicators are there?
They are divided into several types, each solving its own task:
- Trend indicators (EMA, SuperTrend, MACD) — determine the direction and strength of a trend. Work well in trending markets, generate many false signals in sideways markets.
- Oscillators (RSI, Stochastic, CCI) — show overbought and oversold conditions. Effective in sideways markets, but in a trend they can remain in extreme zones for a long time.
- Volume indicators (MFI, Volume Spike) — analyze trading volume. Help determine whether a price move is backed by real participant interest or is just empty movement.
Why doesn’t a single indicator solve everything?
The market is a multidimensional system, and any indicator shows only one part of the picture. That’s why professional traders combine several indicators of different types: one defines the trend, a second finds the entry point, a third confirms the signal with volume.
One indicator is a hypothesis. Several indicators of different types — that’s confirmation
The Veles bot configurator has ready-made templates for a quick start suited to any trading style.
