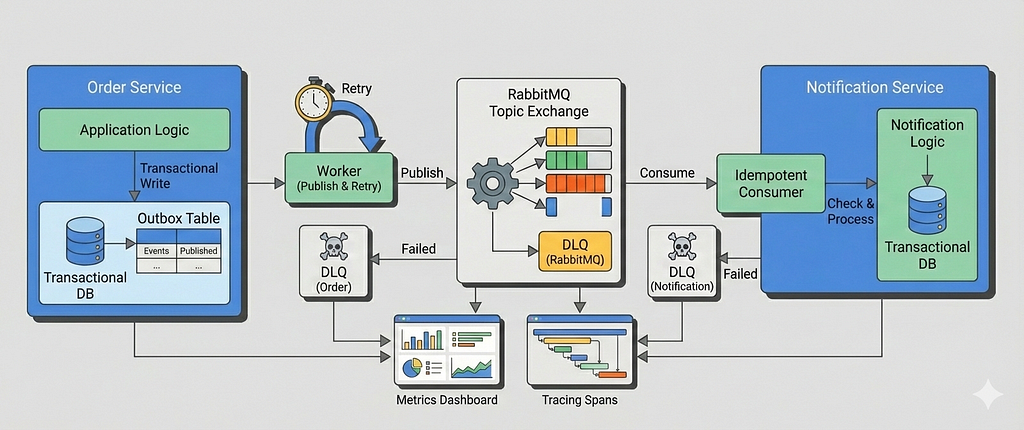
In Part 1, we built a correct and production-oriented foundation for the transactional outbox pattern using Go, PostgreSQL, and RabbitMQ. We ensured that domain state changes and event creation were atomic, published events asynchronously via a poll-based outbox worker, and enforced exactly-once processing on the consumer side using idempotency.
That baseline system already solves the hardest problem: correctness under partial failure.
But correctness alone isn’t enough in real-world systems.
Once this pattern hits production, new questions immediately surface:
- What happens when publishing to RabbitMQ fails repeatedly?
- How do we retry safely without flooding the broker or duplicating work?
- How do consumers handle poison messages?
- When should events be retried, and when should they be sent to a dead-letter queue?
- How do we observe failures early, before downstream systems silently degrade?
- At higher scale, is polling still the right choice or should CDC-based approaches be considered?
This article answers those questions.
In Part 2, we extend the system from Part 1 with failure-aware behavior and operational guardrails, without changing the core model. The transactional outbox remains the source of truth; we simply make it resilient, observable, and easier to operate under load.
Specifically, we’ll cover:
- Retry strategies for the outbox publisher with exponential backoff
- Dead Letter Queues (DLQs) for events that cannot be published
- Consumer-side retries and dead-letter exchanges
- Operational metrics and dashboards that surface failure modes early
- A practical discussion of Polling vs CDC-based outbox implementations (Debezium + Kafka), including trade-offs and when each approach makes sense
This is not a rewrite of the system from Part 1.
Instead, it’s an evolution, the kind that happens after the first real incident.
By the end of this article, you’ll understand how to take a correct outbox implementation and turn it into one that’s boring to operate, even when things go wrong.
Table of Content
- Failure as a First-Class Design Constraint
- Retrying Outbox Publishing (Producer-Side Retries)
- Moving permanently failed events to a DLQ
- Consumer-Side Retries Using Dead-Letter Exchanges
- What To Do With Messages in the DLQ
- Retry & Failure Metrics
- Tracing & Outcome Visibility
- CDC-Based Outbox as an Alternative
- Conclusion
Failure as a First-Class Design Constraint
In distributed systems, failure isn’t an edge case, it’s the normal operating condition.
Message brokers go down, consumers crash and restart, networks partition, bad data makes it to production.
Retries exist because things will fail, not because we expect them to succeed eventually.
But retries are also dangerous.
Poorly designed retries don’t fix problems, they amplify them:
- Retrying inline in request handlers ties user latency to broker availability
- Tight retry loops can overwhelm databases and brokers
- Retrying without backoff creates retry storms
- Retrying forever hides broken messages instead of surfacing them
Not all failures are transient. Some messages will never succeed due to invalid payloads or schema mismatches. A healthy system must know when to stop retrying and move on.
Well-designed retries share a few properties:
- asynchronous for background workflows and message processing
- bounded (no infinite loops)
- backoff-aware (to avoid overload)
- observable (failures are visible, not silent)
- built on idempotency
The transactional outbox gives us a natural place to implement this safely: durable retry state, explicit event lifecycle, and isolation from request paths.
In the next section, we’ll extend the outbox worker with retry logic and exponential backoff, turning failures into delayed work instead of cascading outages.
Retrying Outbox Publishing (Producer-Side Retries)
In Part 1, a failed publish immediately moved the event to a failed state. That was intentional, it gave us a correct baseline without hiding failure.
In real systems, however, most publish failures are transient: brief broker outages, network hiccups, or short-lived resource pressure. Retrying these events is both safe and expected, as long as retries are designed carefully.
In this section, we extend the outbox worker to support bounded, delayed retries with exponential backoff, while keeping all retry state durable and observable.

Schema changes for retries
To support retries, the outbox needs to track how many times an event has been attempted and when it becomes eligible again.
The Part 2 schema extends outbox_events with two new columns:
CREATE TABLE outbox_events (
  id TEXT PRIMARY KEY,
  event_key TEXT NOT NULL,
  payload JSONB NOT NULL,
  status OutboxEventStatus NOT NULL,
  retry_count INT NOT NULL DEFAULT 0,
  next_retry_at TIMESTAMP NULL,
  locked_at TIMESTAMP DEFAULT NULL,
  locked_by VARCHAR(128) NULL,
  failure_reason VARCHAR(128) DEFAULT NULL,
  failed_at TIMESTAMP DEFAULT NULL,
  traceparent TEXT NOT NULL,
  created_at TIMESTAMP DEFAULT NOW()
);
Conceptually:
- retry_count tracks how many publish attempts have failed
- next_retry_at enforces backoff by delaying eligibility
- Events remain in the outbox until they are either published or explicitly dead-lettered
Retries change how workers select events, so indexing needs to reflect that.
CREATE INDEX idx_outbox_events_pending_ready
ON outbox_events (created_at)
WHERE status = 'pending';

CREATE INDEX idx_outbox_events_retryable
ON outbox_events (locked_at, next_retry_at, created_at)
WHERE status = 'in_progress';
idx_outbox_events_pending_ready Optimizes the common case: picking the oldest pending events ready to publish.
idx_outbox_events_retryable Speeds up recovery scenarios where:
- a worker crashed (locked_at expired), or
- an event is waiting for its retry delay (next_retry_at <= now())
Using partial indexes keeps them small and focused, avoiding unnecessary index scans on completed or failed events.
Making the worker retry-aware
Retries are modeled as delayed eligibility, not as a new status.
An event is eligible for publishing if:
- it is pending, or
- it was abandoned by a crashed worker (in_progress lease expired)
- and its retry delay has elapsed
The worker’s polling query is updated accordingly:
UPDATE outbox_events
SET
  status = ?,
  locked_at = NOW(),
  locked_by = ?
WHERE id IN (
  SELECT id
  FROM outbox_events
  WHERE
    (
      status = ?
      OR (
        status = ?
        AND locked_at < NOW() - INTERVAL '30 seconds'
      )
    )
    AND (
      next_retry_at IS NULL
      OR next_retry_at <= NOW()
    )
  ORDER BY created_at
  LIMIT ?
  FOR UPDATE SKIP LOCKED
)
RETURNING *
This ensures that:
- events under backoff are skipped
- retries are naturally spread out over time
- multiple workers can run safely without coordination
Retrying on transient publish failures
When publishing fails, the worker no longer immediately marks the event as failed.
Instead, it schedules a retry by resetting the event to pending and pushing next_retry_at into the future.
func (o *Outbox) scheduleRetry(ctx context.Context, event *model.OutboxEvent) {
    backoff := backoff(event.RetryCount, o.config.RetryDelaySeconds)

    err := o.outboxEventService.UpdateState(ctx, event.ID, map[string]interface{}{
        "status":        model.OutboxEventStatusPending,
        "retry_count":   event.RetryCount + 1,
        "next_retry_at": time.Now().Add(backoff),
        "locked_at":     nil,
        "locked_by":     nil,
    })
    if err != nil {
        o.log.Error("Failed to schedule retry for event",
            logger.Field{Key: "error", Value: err.Error()},
        )
    }
}
Key points:
- Retry state is fully durable
- No in-memory timers or loops
- Worker crashes do not lose retry intent
- Backoff is enforced by the database, not the process
Exponential backoff with jitter
Retries use exponential backoff with jitter to avoid retry storms when multiple workers fail at once:
func backoff(retryCount int, baseDelay time.Duration) time.Duration {
    jitter := time.Duration(randInt(0, 1000)) * time.Millisecond
    return time.Duration(1<<uint(retryCount))*baseDelay + jitter
}

func randInt(min int, max int) int {
    return min + rand.Intn(max-min)
}
This gives us:
- fast recovery for transient blips
- increasing delays under sustained failure
- natural spreading of retry attempts across workers
Retries are capped (e.g. max 3 attempts) to prevent infinite loops.
Moving permanently failed events to a DLQ
A Dead Letter Queue (DLQ) is a dedicated queue for messages that could not be processed successfully and should no longer be retried.
Its role is not automatic recovery, but isolation, visibility, and controlled handling of bad events.
Not all failures are transient.
If an outbox event exceeds the maximum retry count, it is treated as permanently failed and published to a DLQ instead of the normal exchange.
func (o *Outbox) publishToDLQ(
    ctx context.Context,
    ch *amqp091.Channel,
    event *model.OutboxEvent,
    procErr error,
) {
    dlqEvent := map[string]interface{}{
        "event_id":       event.ID,
        "event_key":      event.EventKey,
        "payload":        event.Payload,
        "failed_at":      time.Now(),
        "failure_reason": procErr.Error(),
    }

    err := o.rabbitmq.Publish(
        ctx,
        &rabbitmq.PublishOpts{
            Ch:         ch,
            Exchange:   o.amqpConfig.DLX,
            RoutingKey: o.amqpConfig.DLQ,
            Body:       dlqEvent,
            Headers:    amqp091.Table{"message_id": event.ID},
        },
    )
    if err != nil {
        o.log.Error("Failed to publish event to DLQ", logger.Field{Key: "error", Value: err.Error()})
        return
    }
}
We use a dedicated exchange:
outbox.dlx
Instead of reusing the original event routing key (e.g. order.created), we publish using the DLQ name itself as the routing key:
order-service.dlq
The Order Service declares and binds:
Queue: order-service.dlq
Binding key: order-service.dlq
Using the DLQ name as the routing key makes DLQ ownership explicit and keeps failed events isolated per microservice, without overloading domain event routing keys with failure semantics.
Once published to the DLQ, the outbox event is marked as failed and is no longer eligible for retries.
If DLQ publishing fails, the event remains failed and is surfaced via logs and metrics. DLQs are an operational signal, not a delivery guarantee.
At this point, retries are no longer a best-effort loop, they’re a durable, observable state machine, with the outbox as the single source of truth.
Consumer-Side Retries Using Dead-Letter Exchanges
Once a message is successfully published, failures shift from the broker to the consumer. These failures fall into two broad categories:
- Permanent failures — malformed payloads, missing headers, invalid data
- Transient failures — database outages, timeouts, temporary dependency issues
Retrying both the same way is a mistake. Retrying permanent failures wastes resources, while retrying transient failures incorrectly can amplify load and slow down the entire system.
For consumer-side retries, we rely on RabbitMQ dead-letter exchanges (DLX) instead of retrying in application code.
Retry Topology
Retries are modeled as explicit retry levels, each with its own delay:
RetryConfig{
    Levels: []RetryLevel{
        {"retry.30s", 30 * time.Second},
        {"retry.1m",  1 * time.Minute},
        {"retry.5m",  5 * time.Minute},
    },
}
Each retry level consists of:
- A retry exchange (e.g. outbox.events.retry.30s)
- A retry queue with:
- x-message-ttl
- x-dead-letter-exchange pointing back to the main exchange
When a message expires in a retry queue, RabbitMQ automatically republishes it to the original exchange using the same routing key.
This design allows a single retry topology to handle multiple event types (order.created, order.updated, etc.) without creating per-routing-key queues.

Classifying Failures
The consumer explicitly signals whether a failure is retryable:
var (
    ErrPermanent = errors.New("permanent error")
    ErrTransient = errors.New("transient error")
)
Examples:
- JSON unmarshalling failure → permanent
- Database query failure → transient
if err := json.Unmarshal(message.Body, &body); err != nil {
    return fmt.Errorf("%w: failed to unmarshal message body", ErrPermanent)
}
This keeps retry decisions deterministic and easy to reason about.
Retrying a Message
Retries are handled by republishing the message to the next retry exchange.
Retry state is tracked via headers:
- x-retry-count increments on each retry
- The message body and routing key remain unchanged
headers["x-retry-count"] = retryCount + 1

Publish(
    exchange: "outbox.events.retry.30s",
    routingKey: message.RoutingKey,
)
The original message is always ACKed, regardless of success or failure.
We never rely on broker re-delivery. Retries are explicit and fully controlled by retry queues.
Why There Is No Native Jitter on the Consumer Side
TTL-based retries in RabbitMQ are deterministic: messages expire at fixed intervals and are re-queued at the same time they were originally published. Unlike producer-side retry logic, consumers do not have a natural place to introduce per-message jitter without delaying acknowledgements or holding messages in memory.
As a result, when many messages fail simultaneously, retries tend to align and create short-lived spikes in traffic. In high-throughput systems, one way to mitigate this is to shard retry queues per retry level and route messages deterministically using a hash of message identity. This spreads retries over time without introducing artificial sleeps or per-message jitter, though it’s generally better to observe retry behavior and throughput in production before optimizing the retry strategy further.
When Retries Are Exhausted
If no retry level remains, the message is treated as permanently failed and published to a dead-letter queue (DLQ):
- Routing key is the DLQ name (service-owned)
- Publishing is best-effort
- No further retries are attempted
Example:
Exchange: outbox.dlx
Queue: notification-service.dlq
Routing key: notification-service.dlq
At this point, the failure is considered operational or data-related and requires manual inspection.
What To Do With Messages in the DLQ
A DLQ is not a trash can. It’s a decision point.
Once a message lands in the DLQ, automated retries have stopped and the system is intentionally asking for human judgment.
In practice, DLQ handling usually falls into three categories:
1. Inspect and discard
Some messages are fundamentally invalid:
- schema mismatches
- corrupted payloads
- missing required fields
After inspection, these events are discarded, and the root cause is fixed upstream.
The DLQ acts as a safety net, not a backlog.
2. Fix data and replay
Some failures are recoverable with intervention:
- missing reference data
- temporary downstream misconfiguration
- bad assumptions fixed in code
These messages can be:
- corrected manually, or
- replayed after the consumer or producer is fixed
Because DLQ messages preserve payload and metadata, replay is deliberate, not accidental.
3. Escalate operationally
A growing DLQ is often a system-level signal:
- a consumer deployment is broken
- an external dependency changed behavior
- retry limits are too low
In this case, the DLQ is less about the messages themselves and more about triggering alerts, dashboards, and on-call investigation.
DLQs shift failure from automation to operations.
They make failures visible, bounded, and actionable. which is exactly what a reliable system needs.
Retry & Failure Metrics
In the previous article, we focused on whether events are flowing at all.
Once retries and DLQs enter the picture, the question shifts slightly:
Are failures behaving the way we expect them to?
Retries are not inherently bad but unbounded or misaligned retries are.
The following metrics make retry behavior visible, bounded, and explainable, without turning this into an observability deep dive.
Retry attempts
outbox_retries_total
This counter tracks how many times an outbox event is scheduled for retry.
It answers a simple but important question:
How often are we failing, but recovering later?
A low, steady retry rate is usually acceptable.
A sudden spike often indicates:
- a downstream dependency outage
- transient broker or network failures
- a bad deploy causing temporary publish errors
This metric is incremented only when an event fails to publish and is rescheduled, not when it is first written.
metrics.OutboxRetriesTotal.Inc()
In practice, an alert would trigger only if retry spikes correlate with other symptoms, such as:
- a growing outbox backlog
- increasing publish latency
Retries without backlog growth usually mean the system is degrading gracefully.
Retry exhaustion
outbox_retry_exhaustions_total
This counter tracks how many events have exceeded the maximum retry limit.
At this point, the system has made a conscious decision:
This event will not be published through the normal path.
A non-zero value here is expected over long periods.
However, a sudden increase usually signals a persistent failure, while sustained growth means retries are no longer helping and are only delaying failure.
This metric is incremented exactly once per event, when retry limits are exceeded.
metrics.OutboxRetryExhaustionsTotal.Inc()
In practice, an alert would trigger if:
- retry exhaustions suddenly spike above baseline
- or retry exhaustions grow steadily relative to total event volume
Dead-letter publishing
Once retries are exhausted, events are sent to a Dead Letter Queue (DLQ).
We track this explicitly using two counters:
outbox_dlq_published_total
outbox_dlq_publish_failed_total
These metrics distinguish between:
- events intentionally routed to the DLQ
- failures while publishing to the DLQ itself (a much more serious issue)
metrics.OutboxDLQPublishedTotal.Inc()
metrics.OutboxDLQPublishFailedTotal.Inc()
If outbox_dlq_publish_failed_total increases, it usually indicates:
- misconfigured DLX / DLQ bindings
- broker-level issues
- permission or exchange configuration problems
In practice, an alert would trigger if:
- DLQ publishes spike unexpectedly
- or any DLQ publish failures occur, since this implies events are no longer safely retained
Consumer-side retry & DLQ visibility
On the consumer side, we also track retry and DLQ behavior, alongside core processing metrics like:
- consumer_messages_total
- consumer_processing_failed_total
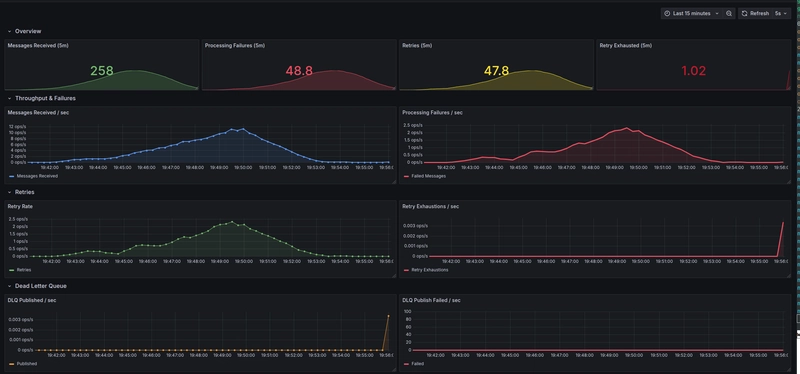
Together, these metrics feed into a dedicated Consumer Processing Dashboard, giving a clear view of throughput, failure rates, and terminal outcomes without overloading the system with cardinality-heavy signals.
Separating concerns with dedicated dashboards
To avoid mixing responsibilities, we intentionally use two focused dashboards:
Outbox Reliability Dashboard
This dashboard answers one core question:
Is the event publishing pipeline healthy?
It focuses on:
- outbox backlog growth
- publish latency
- retry and retry-exhaustion rates
- DLQ routing from the outbox

Consumer Processing Dashboard
This dashboard answers a different question:
Are downstream business operations succeeding?
It focuses on:
- message consumption rate
- processing failure rate
- retry queue activity
- DLQ volume and trends
Keeping these dashboards separate prevents alert fatigue and makes ownership clearer:
outbox issues are usually infrastructure or configuration problems, while consumer issues tend to be business logic or dependency failures.
Together, they provide a complete picture of the event lifecycle, from transactional write to final business outcome without overloading any single view.
Tracing & Outcome Visibility
In this article, we deliberately keep tracing lightweight.
There are no new spans for retries, DLQ hops, or internal helpers. Instead, we focus on making the existing spans more expressive by attaching the right attributes.
This keeps traces readable while still answering the questions you actually ask during incidents.
Outcomes as first-class signals
Internally, each processing attempt is classified into one of a small, well-defined set of outcomes:
- published — successfully sent to the broker
- retry — failed, but scheduled for another attempt
- dlq — retries exhausted, sent to DLQ
- failed — internal failure (e.g. DB update or retry scheduling failure)
While counters remain intentionally simple, these outcomes are attached as trace attributes, allowing us to reason about individual event lifecycles.
This avoids exploding metric cardinality while still preserving detail in traces.
Enriching spans with outcomes
Both the outbox publisher and the consumer record a single span per message, and attach an explicit outcome to it.
For the outbox:
attribute.String("outbox.outcome", "published|retry|dlq|failed")For the consumer:
attribute.String("consumer.outcome", "success|retry|dlq|failed")This makes it trivial to:
- filter traces by failure mode
- distinguish retries from terminal failures
- answer “what happened to this message?” without reading logs
Instead of inferring intent from error messages or span status, the outcome is made explicit.
Retry visibility without span explosion
Retries are represented via attributes rather than additional spans:
attribute.Int("event.retry_count", event.RetryCount) //Outbox
attribute.Int("rabbitmq.retry_count", getRetryCount(message.Headers)) //Consumer
This avoids a common pitfall where retry-heavy systems generate deeply nested or noisy traces.
You still get full visibility into retry behavior, but without sacrificing trace clarity.
Trace–log correlation
While the dashboards in this article focus on metrics, the codebase also supports trace–log correlation.
All log statements accept a context via:
logger.WithContext(ctx)
When enabled, this automatically attaches trace and span IDs to logs, allowing you to:
- jump from a trace in Jaeger to the exact logs that belong to it
- correlate retries, DLQ publishes, and failures without manual searching
For brevity, we don’t include log-based dashboards here, but the hooks are intentionally present so readers can experiment and extend the system if needed.
CDC-Based Outbox as an Alternative
Another way to implement the outbox pattern is by combining it with Change Data Capture (CDC).
Instead of running a background worker that periodically polls the outbox_events table, CDC-based approaches stream database changes directly from the database’s write-ahead log (WAL) into a message broker. Tools like Debezium can capture inserts into the outbox table and publish them to Kafka topics with very low latency.
At a high level, the flow looks like this:
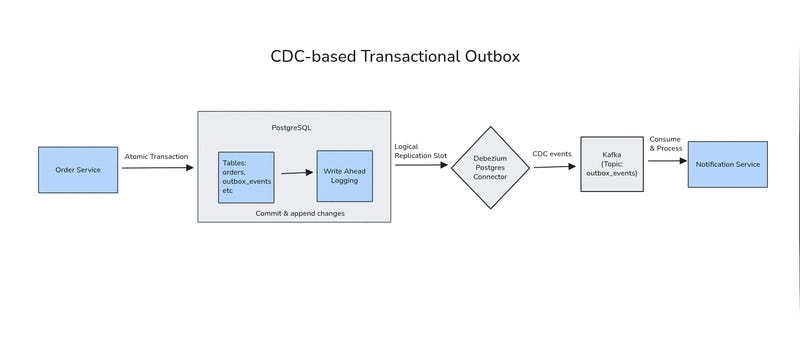
From an application perspective, the outbox table remains exactly the same. Domain events are still created explicitly, with well-defined payloads and clear business intent. The difference lies entirely in how those events leave the database.
What CDC Changes
With CDC, new outbox rows are emitted almost immediately after the transaction commits. There is no polling interval, no periodic SELECT queries, and no need to tune batch sizes. Event delivery becomes effectively push-based, driven by database writes rather than background scans.
This can be especially attractive when:
- low end-to-end latency is important
- the outbox table grows quickly
- polling overhead on the primary database needs to be minimized
In practice, CDC turns the outbox into a streaming source, while preserving the core benefits of the transactional outbox pattern: atomic writes, durable state, and explicit event lifecycles.
Trade-offs and Operational Cost
While CDC reduces polling-related concerns, it introduces a different kind of complexity.
A CDC-based outbox typically requires:
- logical replication enabled at the database level
- replication slots and WAL retention management
- a CDC connector (e.g., Debezium) running reliably
- Kafka (or a similar log-based broker) as infrastructure
These components add operational surface area and failure modes that don’t exist in a simple polling-based design. Connector configuration, schema evolution, topic management, and offset handling become part of the system’s responsibility.
For many teams, this is a reasonable trade-off. For others, especially smaller teams or services with moderate throughput, the added infrastructure may outweigh the latency benefits.
Choosing Between Polling and CDC
Both polling-based and CDC-based outbox implementations solve the same core problem: reliably publishing domain events without breaking transactional guarantees.
Polling favors simplicity, explicit control, and minimal infrastructure.
CDC favors lower latency and push-based delivery, at the cost of operational complexity.
There is no universally “correct” choice. The right approach depends on scale, team maturity, and operational constraints.
As with most distributed systems patterns, real-world implementations may vary in complexity. The comparison here is intentionally simplified to highlight trade-offs, not prescribe a one-size-fits-all solution.
Conclusion
In this article, we extended the transactional outbox pattern with producer-side retries, consumer-side retries, and dead-letter handling, while adding observability through metrics, dashboards, and distributed tracing. With these building blocks, the outbox becomes robust, debuggable, and ready to handle transient and permanent failures gracefully.
The provided Prometheus metrics and Jaeger traces give you visibility into backlog, retry attempts, publish outcomes, and DLQ traffic, while logger.WithContext() allows logs to correlate with spans for deeper insight. Together, these tools make it easy to monitor and troubleshoot the system, and even experiment with load, stress, or chaos testing on your own.
Thanks for reading! If you have any questions or insights, please leave a comment.
You can also check out the full working example on GitHub.
Transactional Outbox with RabbitMQ (Part 2): Handling Retries, Dead-Letter Queues, and Observability was originally published in Level Up Coding on Medium, where people are continuing the conversation by highlighting and responding to this story.