Everyone is building AI-powered services. Almost nobody is thinking about what happens when they break.

Three weeks after shipping. Everything looks fine on the surface — the service is running, requests are being handled, users are getting responses.
Then it isn’t fine anymore.
Latency has quietly crept from 400ms to 6 seconds. Token costs doubled. Some users are getting responses that are subtly wrong — no error, no stack trace, just wrong. And you’re staring at logs that tell you absolutely nothing useful.
Welcome to the LLM observability gap. It’s the part of AI engineering that nobody talks about at conferences, but every team hits eventually.
LLM Services Break Differently. Your Observability Needs to Match
Here’s the thing about traditional microservices: they fail loudly. Database down, 500 thrown, alert fires, engineer wakes up, problem fixed. The feedback loop is tight.
LLM services don’t work that way. They fail in ways that look like success:
- The LLM returns a response — valid JSON, correct status code — but the content is garbage. No exception thrown. No error logged.
- Your p99 latency is 14 seconds. Your p50 is 600ms. The average you’ve been watching? 1.2 seconds. Looks fine.
- A prompt change three weeks ago made responses 40% more verbose. Your token bill has been climbing ever since. The service still works.
- The provider is rate-limiting you. Requests are queuing silently. Users are waiting. Your health check says green.
A service with zero errors in the logs can be completely broken from a user’s perspective. That’s not a hypothetical — it’s what happens when you treat an LLM service like a CRUD API.
The fix isn’t complicated. But it does require four specific things.
1. Distributed Tracing — Stop Guessing Where Time Goes
A 6-second response time is a useless data point without context. Is it your preprocessing? The LLM provider? Your database fetch for context? The network round-trip?
Distributed tracing breaks that number apart. And for LLM services specifically, the split between “time in your code” vs “time waiting for the provider” is the most important thing to know. One you can fix. The other you can’t — but you can at least stop blaming your own code for it.
GoFr instruments every handler and database call with OpenTelemetry automatically. You add spans around the parts that matter most — the LLM call:
func generateResponse(ctx *gofr.Context, prompt string) (string, error) {
 span := ctx.Trace("llm-provider-call")
 defer span.End()

 span.SetAttributes(
  attribute.Int("prompt.token_estimate", estimateTokens(prompt)),
  attribute.String("llm.model", "gpt-4o"),
  attribute.String("llm.endpoint", "chat-completions"),
 )

 response, err := callLLMProvider(ctx, prompt)
 if err != nil {
  span.RecordError(err)
  return "", err
 }

 span.SetAttributes(
  attribute.Int("response.tokens", response.TokensUsed),
  attribute.Float64("response.latency_ms", response.LatencyMS),
 )

 return response.Text, nil
}
Now your trace dashboard shows the full picture: GoFr’s automatic spans for your HTTP handler and DB calls, plus your custom span for the LLM provider. You know immediately whether the problem is yours or theirs. That distinction alone is worth the 10 lines of code.

2. Structured Logging — Logs You Can Actually Use at 2 AM
Unstructured logs are a development convenience. In production, they’re a liability.
For LLM services, structured logging does something beyond just debugging: it gives you a queryable history of what your service said and why. That matters when a user reports “the AI gave me wrong information” and you need to reproduce the exact prompt and response from 3 days ago.
GoFr’s logger writes structured JSON by default — request ID, timestamp, service context are already there. You add the fields that matter for your LLM service:
func handleChatRequest(ctx *gofr.Context) (interface{}, error) {
 var req ChatRequest
 ctx.Bind(&req)

 ctx.Logger.Info("llm request received",
  "user_id",     req.UserID,
  "model",       req.Model,
  "prompt_len",  len(req.Prompt),
 )

 response, err := generateResponse(ctx, req.Prompt)
 if err != nil {
  ctx.Logger.Errorw("llm request failed",
   "error",      err.Error(),
   "model",      req.Model,
  )
  return nil, err
 }

 ctx.Logger.Infow("llm request completed",
  "tokens_used",    response.TokensUsed,
  "latency_ms",     response.LatencyMS,
  "model",          req.Model,
 )

 return response, nil
}
Now “show me all requests where tokens_used > 2000” is a single filter. “Show me every failed request for user X this week” is instant. The audit trail for wrong outputs exists. Without structure, that investigation is 45 minutes of grep and guesswork.
3. Metrics — The Numbers That Actually Tell You If You’re Healthy
Traces answer “what happened in this request.” Metrics answer “what’s been happening across all requests for the past week.” Both matter.
For a regular API, CPU, memory, and request rate are usually enough. For an LLM service, those metrics tell you almost nothing. Here’s what actually matters:
- Token usage over time, by endpoint. This is your cost metric. A prompt change that makes responses 30% longer won’t show up anywhere else — but it will show up here, before your billing alert fires.
- LLM provider latency as a histogram, not an average. The average lies. What you need is p50, p95, p99. An LLM provider with a 600ms median and a 14-second p99 is a provider that’s making 1% of your users miserable, and the average will never show you that.
- Error counts by type — separately. Rate limit errors, timeouts, and malformed responses are different problems requiring different fixes. Lumping them into a single error counter tells you something is wrong. Separate counters tell you what to do about it.
- Cache hit rate. If you’re caching responses for repeated prompts, this number directly maps to money saved.
func main() {
        a := gofr.New()

        a.Metrics().NewCounter("llm_tokens_total", "Total tokens consumed")

        a.Metrics().NewHistogram("llm_duration_seconds", "LLM provider call latency",
                0.1, 0.5, 1, 2, 5, 10, 30)

        a.Metrics().NewCounter("llm_errors_total", "LLM errors by type")

        // ... register handlers and run

        a.Run()
  }
GoFr exposes /metrics in Prometheus format automatically. These counters plug straight in. Wire them to Grafana and you have a live view of cost, latency distribution, and error breakdown — the three numbers that actually tell you whether your LLM service is healthy.
4. Health Checks — Degraded Is Not the Same as Dead
A standard health check answers: is the process running? For an LLM service, that’s the least interesting question.
The questions that actually matter are: Is the provider responding within acceptable latency? Are we approaching rate limits? Are downstream dependencies healthy?
GoFr auto-exposes /.well-known/health and checks all registered dependencies automatically. For your LLM provider, you register it as an external HTTP service — GoFr then health-checks it on a schedule and includes it in the health response:
func main() {
 app := gofr.New()

 // Register the LLM provider as an external HTTP service.
 // GoFr automatically calls the HealthEndpoint periodically
 // and includes its status in /.well-known/health.
 app.AddHTTPService("llm-provider", "https://api.openai.com",
  &service.HealthConfig{
   HealthEndpoint: "v1/models", // endpoint GoFr pings to check provider health
  },
  &service.CircuitBreakerConfig{
   Threshold: 4,              // open circuit after 4 consecutive failures
   Interval:  1 * time.Second,
  },
 )

 app.POST("/v1/chat", handleChatRequest)
 app.Run()
}

func handleChatRequest(ctx *gofr.Context) (interface{}, error) {
 // Retrieve the registered LLM service client from context
 llmSvc := ctx.GetHTTPService("llm-provider")

 // GoFr automatically logs, traces, and applies circuit breaking to this call
 resp, err := llmSvc.Post(ctx, "v1/chat/completions", nil, requestBody)
 if err != nil {
  // If circuit is open, this returns immediately — no 30-second hang
  return nil, err
 }

 defer resp.Body.Close()
 // ... parse and return response
}
This is the right way to think about it — the LLM provider is a downstream HTTP service, not an internal component. GoFr treats it exactly that way. The health check, circuit breaker, tracing, and retry logic all come from AddHTTPService. You get the /.well-known/health distinction between provider-down and service-down for free.
The CircuitBreakerConfig is also the right home for your circuit breaker. After 4 failures within the interval, GoFr opens the circuit — subsequent calls fail fast instead of waiting for a timeout. GoFr even publishes a app_http_circuit_breaker_state metric automatically (0 = closed, 1 = open), which you can alert on directly in Grafana.
5. Circuit Breakers — When to Stop Trying
This is the one resilience pattern most LLM service skip. And it’s the one that saves you when a provider has an outage.
Without a circuit breaker, here’s what happens when your LLM provider goes down: every request waits for the full timeout (often 30 seconds), then fails. Thread pools fill up. Memory spikes. Other endpoints that have nothing to do with the LLM start failing too. One provider outage takes down your entire service.
In GoFr, the circuit breaker lives exactly where it should — on the external HTTP service registration. There’s no separate implementation needed:
app.AddHTTPService("llm-provider", "https://api.openai.com",
    &service.CircuitBreakerConfig{
        Threshold: 4,               // open after 4 consecutive failures
        Interval:  1 * time.Second, // within this window
    },
)
After 4 failures within the interval, GoFr opens the circuit. Requests to the LLM provider fail immediately — no 30-second hang, no thread pool exhaustion. GoFr automatically publishes app_http_circuit_breaker_state (0 = closed, 1 = open) to your metrics endpoint. Set a Grafana alert on that metric and you'll know the moment a provider starts struggling — before your users tell you.
The circuit periodically retries the provider to detect recovery. When it closes, traffic resumes automatically. You don’t write any of this logic — it’s configuration.
The Pitfalls Table
Most LLM service problems fall into a predictable set of categories. Here’s what to watch for and what each one tells you:
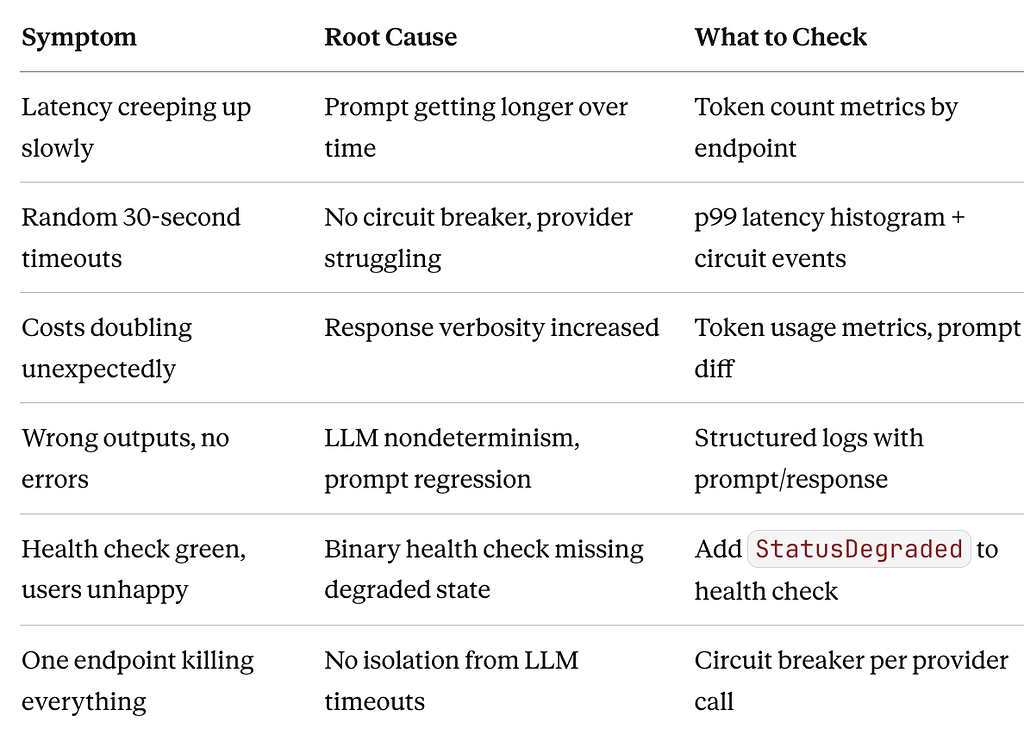
If you’re debugging an LLM service problem right now, start with this table. The column that matters most is “What to Check” — because you can only check it if you built the observability stack first.
What GoFr Gives You vs. What You Build
To be concrete about the division of work:
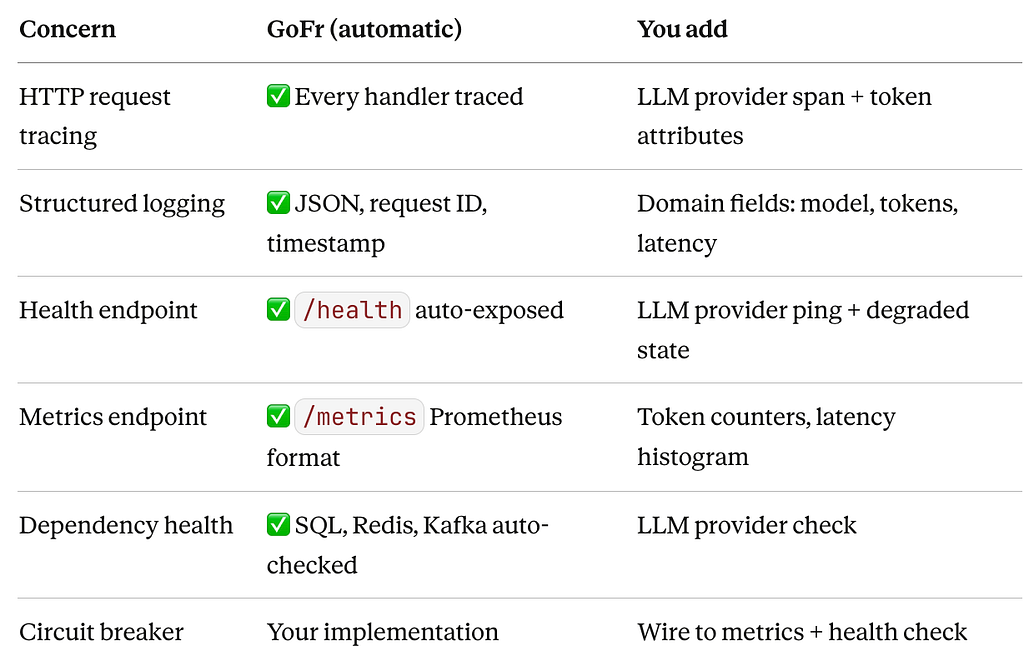
The “You add” column is maybe 100 lines of code across your entire service. The “GoFr (automatic)” column is what would take you days to wire up from scratch — and would probably get skipped the first time because there’s always a feature to ship instead.
Closing Thoughts
The engineers who’ve been burned by LLM services in production all say the same thing: they wish they’d built the observability before they built the feature.
It’s not that the problems are unforeseeable — token cost creep, tail latency, provider outages, silent wrong outputs. These are all known failure modes. The issue is that without visibility, you’re discovering them through user complaints instead of dashboards.
GoFr doesn’t prevent LLM failures. Nothing does — the nondeterminism is the point. But it puts the traces, logs, metrics, and health checks in place from the moment you call gofr.New(). Your job is to add the 100 lines of domain context that make them meaningful for an AI service.
Build the stack first. Ship the feature second. The 2 AM alert you avoid will be worth it.
GoFr is an open-source Go microservices framework built for production. Explore it at gofr.dev and give it a ⭐ on GitHub.
The Observability Stack Every LLM-Powered Go Service Needs was originally published in Level Up Coding on Medium, where people are continuing the conversation by highlighting and responding to this story.


