The Math Behind Position Sizing: How Much Should You Really Invest Per Trade?
Kelly Criterion and Risk of Ruin — the math behind every bet you make.
 Henrique Centieiro9 min read·1 hour ago
--
Most traders and investors — even professionals — size their positions like complete amateurs.
Position sizing is one of the most important concepts in trading, yet it’s widely misunderstood and ignored — at the cost of big losses and even ruin.
Over my 20-year investment career, I’ve seen this firsthand — across funds and family offices.
So, if you have $100,000 to invest and you’re about to buy stock A, how much are you going to invest? Will it be 1% of your portfolio? 10%? Or a fixed amount, such as $25,000?
In this article, I’ll break down the mathematics of position sizing. Stick around, because this math makes and breaks investors.
This post was first published on Substack. If you want to be the first to read it, subscribe here.
The Science of Position Sizing: How Much Should You Really Bet?
These following 3 approaches can be used individually or in combination, depending on your trading setup. All of them are important frameworks to investing and position sizing.
Approach 1: The Investor’s Kelly — Optimal Allocation & Leverage Sizing
I’ve talked about the Kelly Criterion extensively in the past, but here’s a bit of background: Developed by John Kelly Jr. at Bell Labs in 1956, it was originally intended for information theory. Kelly was a genius who worked together with John von Neumann. Unfortunately, he smoked six packs of cigarettes per day and died at the age of 41.
The Kelly Criterion calculates the optimal bet size in gambling or investing, and it can be applied as long as you have a positive expected value (EV).
If I’m not mistaken, it was first applied by Edward O. Thorp, the guy who invented the blackjack card-counting method that got him banned from most casinos.
Thorp realized that in blackjack, a player could use card counting to better understand the probabilities of winning the next hand. Based on these probabilities, you would increase or decrease your bet using the Kelly Criterion: a higher probability of winning demands a higher bet, but not so high that if you lose a few hands, you go bankrupt.
Thorp later founded a hedge fund that also used the Kelly Criterion to maximize long-term growth.
The first version of the Kelly Criterion I want to talk about calculates how much you should allocate to an investment based on its probability of winning, expected growth, and volatility.
This tells you how much to allocate to any individual investment, whether you should use leverage, and by how much.
So, you want to invest in Tesla stock as a buy-and-hold investment. How much should you invest?
Here’s what Kelly tells us:
g(f) = μ·f − 0.5·σ²·f²Where:
- g(f) = expected growth rate at leverage f
- μ = annualized return
- σ = annualized volatility
- f = leverage multiplier
When you apply this to a stock or index, it shows a curve that looks something like this:
This is the growth function of the Kelly Criterion. I’ve created a free TradingView indicator for anyone to test.
This formula and my indicator tell you something incredibly important: your expected growth rate at any given position size or leverage level.
When you increase your position size or leverage, growth increases up to a point, and then it starts going down.
This happens with every investment, but most investors overlook it.
To find the optimal leverage — the point where growth is maximized over time, you take the peak of this curve, which gives us:
f* = μ / σ²Kelly in Practice: Tesla vs. SPY
Now, let’s run the numbers for two very different investments: Tesla and SPY.
Tesla:
- Annualized return (μ): 37.56%
- Annualized volatility (σ): 63.27%
f* = 0.3756 / 0.6327² = 0.3756 / 0.4003 ≈ 0.94xKelly tells you to allocate about 94% of whatever you thought of investing in Tesla to Tesla stock. No leverage needed. Despite Tesla’s massive returns, its volatility is so high that Kelly says you should go easy on Tesla, or volatility will eat your lunch.
SPY (S&P 500):
- Annualized return (μ): 12.26%
- Annualized volatility (σ): 19.42%
f* = 0.1226 / 0.1942² = 0.1226 / 0.0377 ≈ 3.25x
Kelly is telling you to leverage 3.25x on the S&P 500. This is because the S&P 500 is less volatile and has steadier returns, considering it’s a basket of 500 top American companies.
This is exactly why I’ve been preaching leveraged ETFs like SSO (2x S&P 500) and UPRO (3x S&P 500): they’re a simple way for investors to apply leverage and maximize returns over time.
And if you want to learn more, I have a full 4-hour course on leveraged ETFs in my Henrique Wealth Academy, as well as many articles you can read here.
Now, let’s plug in different leverage levels to see what happens to growth:
Tesla at different allocations:
- f = 0.47 (half Kelly): g = 13.2% growth
- f = 0.94 (Kelly optimal): g = 17.6% growth
- f = 1.0 (fully invested): g = 17.5% growth
- f = 1.5 (1.5x leveraged): g = 11.3% growth
- f = 2.0 (2x leveraged): g = −4.9% growth
At 2x leverage on Tesla, your expected growth rate is actually negative.
The lesson is that no matter how good the performance of a stock is, if you leverage it beyond a certain level, volatility eats you alive.
SPY at different allocations:
- f = 1.0 (fully invested): g = 10.4% growth
- f = 1.63 (half Kelly): g = 15.0% growth
- f = 2.0 (2x leveraged): g = 17.0% growth
- f = 3.25 (Kelly optimal): g = 19.9% growth
- f = 5.0 (5x leveraged): g = 14.2% growth
- f = 6.5 (2x Kelly): g = ≈ 0% growth
With SPY (S&P 500), 2x or 3x leverage improves your growth rate because volatility doesn’t overwhelm returns.
But push past the Kelly optimal point, and growth starts declining again.
This is what people don’t understand about leverage. They talk about volatility decay or volatility drag… but they don’t really do the math behind that.
Why stick to 1x (no leverage), when you could use 1.2x? Or 1.5x? Where do you draw the line?
This is why approaching leverage mathematically matters, and it’s exactly what Kelly gives you.
Why Half Kelly Is the Sweet Spot
It’s very important for me to say that most investors don’t use the full Kelly because it’s still very aggressive and assumes your estimates are perfectly correct.
That’s why most, including Thorp and me, recommend half Kelly. Half Kelly gives you about 75% of the growth rate of full Kelly, but with significantly less volatility and drawdown risk.
For SPY, that would mean about 1.63x leverage instead of 3.25x.
This is why I like to use Kelly for position sizing: high-volatility assets get smaller allocations, and low-volatility assets with good expected returns get larger allocations.
It also tells you whether leverage makes sense or not.
This version of the Kelly Criterion is most useful for long-term investors.
Approach 2: The Trader’s Kelly — Optimal Bet Size for Repeated Trades
The second version of the Kelly Criterion is more appropriate for traders and uses your win rate and reward-to-risk ratio to calculate position sizing.
This version is particularly useful for systematic traders who want to maximize the long-term growth of their trading setup. Say you make 200 trades per month — how much should you risk on each?
This is what Kelly tells us:
Kelly % = Win Rate − (Loss Rate / Win-Loss Ratio)Here’s an example. Out of a sample of 200 trades, on average, you have:
- 60% winning trades where you make $600
- 40% losing trades, where you lose $200
Your win/loss ratio is: $600 / $200 = 3
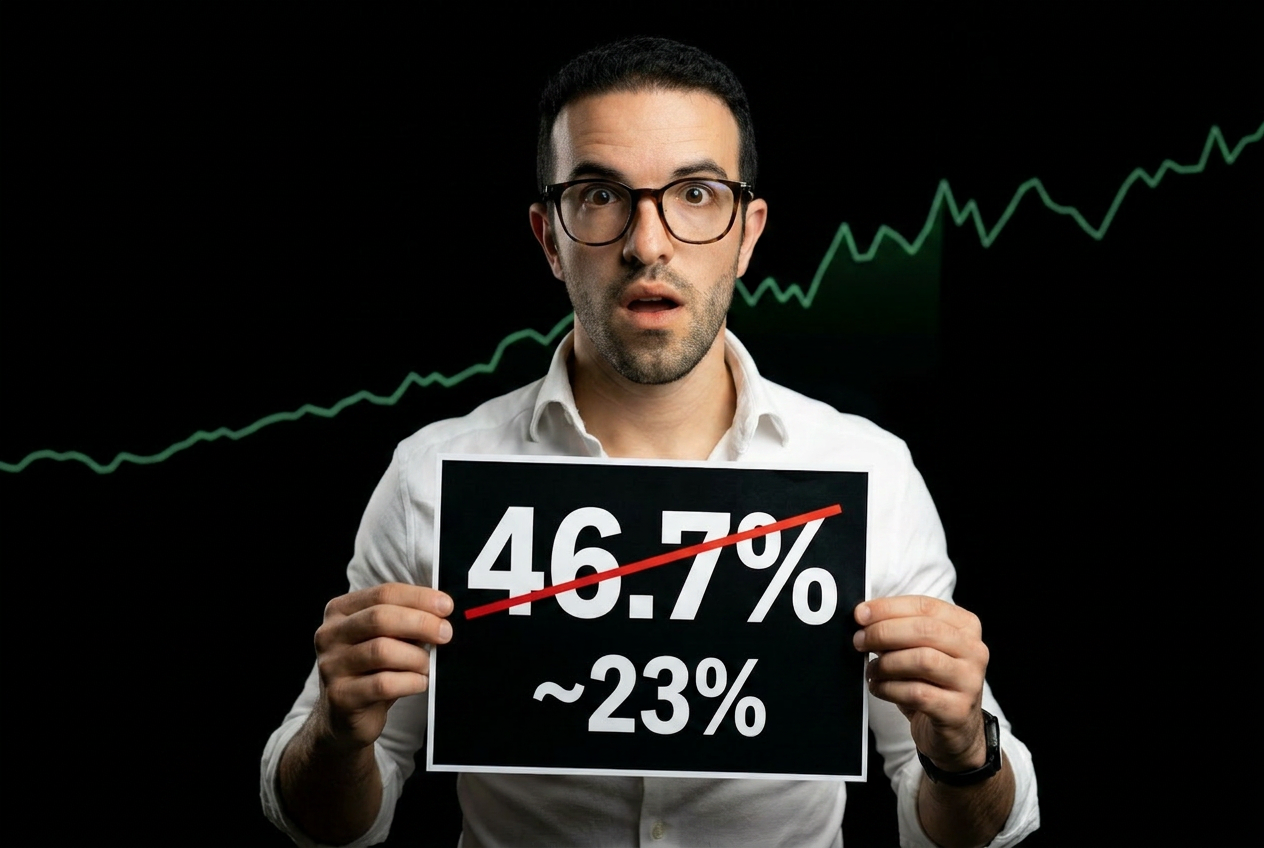
Kelly % = 0.60 − (0.40 / 3) = 0.60 − 0.133 = 46.7%Kelly says you should risk 46.7% of your account on each trade to maximize long-term growth.
That sounds quite aggressive, and you certainly want to minimize the risk of ruin. That’s why most traders use half Kelly instead, which here would be ~23.3%.
Approach 3: Risk of Ruin Approach — Just Don’t Get Out of the Game
Another powerful approach to position sizing is simply to avoid the risk of ruin. The concept of risk of ruin comes from gambling theory, but it can also be applied to trading and investing.
Charlie Munger once said:
“The problem isn’t getting rich, it’s staying in the game.”
Risk of ruin tells you the probability that you will lose your entire account and how much you should invest each time in order to avoid that scenario.
Even if you have a genuine edge in your trading setup, you can still hit enough consecutive losing trades to wipe you out. You can think of this as the inverse of Kelly:
Kelly tells you how much to invest to maximize growth. Risk of Ruin tells you how much you can risk to avoid destruction.
Risk of Ruin = (q / (p × R))ⁿWhere:
- p = win rate
- q = loss rate (1 − p)
- R = reward-to-risk ratio (average win ÷ average loss)
- n = Account Size ÷ Risk per Trade (how many “risk units” fit in your account)
For example, say you have a 55% win rate and a reward-to-risk ratio of 1.5 (you win $1.50 for every $1 you lose). And you have a $100,000 account.
How much should you risk per trade? 1%? 5%? 10%? 20%?
The base of our calculation stays constant:
q / (p × R) = 0.45 / (0.55 × 1.5) = 0.45 / 0.825 = 0.5455Only the exponent n changes with position size.
1% Risk ($1,000 per trade):
- n = $100,000 / $1,000 = 100
- Risk of Ruin = 0.545⁵¹⁰⁰ ≈ virtually 0% of ruin
- You would need an almost impossibly long losing streak to go broke.
5% Risk ($5,000 per trade):
- n = $100,000 / $5,000 = 20
- Risk of Ruin = 0.545⁵²⁰ ≈ 0.0005%, still a very low risk of ruin
10% Risk ($10,000 per trade):
- n = $100,000 / $10,000 = 10
- Risk of Ruin = 0.545⁵¹⁰ ≈ 0.23%, acceptable for most retail investors, but…
- That sounds low, but if you’re making 200 trades a month over a few years, this probability compounds against you.
20% Risk ($20,000 per trade):
- n = $100,000 / $20,000 = 5
- Risk of Ruin = 0.545⁵⁵ ≈ 4.83%
- That means roughly a 5% chance of losing everything.
- You’d probably wouldn’t board a plane with a 5% chance of crashing.
Increasing position size from 5% to 10% multiplies the risk of ruin by over 430x — from 0.0005% to 0.23%. And going from 5% to 20% multiplies it by nearly 9,000x. Think about that.
When it comes to individual stocks, I usually risk 1% to 3% of my portfolio per position, depending on how likely I think each investment is to succeed.
For most investors, anything more than 5% should be considered too risky, unless you’re dealing with extremely high-conviction trades or long-term bets like broad index funds.
Putting It All Together
Think of it this way:
- The Investor’s Kelly is about allocation — it tells you how much to put in and whether to leverage.
- The Trader’s Kelly is precision — it sizes each repeated bet for maximum long-term growth.
- Risk of Ruin is survival — it keeps you in the game long enough to compound the wins.
So, how should we approach it all together?
Well, it depends on your risk profile and investment style. There’s no one-size-fits-all answer, but looking at the math is already a great starting point.
Maybe Kelly tells you to allocate 25% of your portfolio, but your risk of ruin calculations say your ceiling is 12%. You should probably go with the latter — or something in between.
I teach and implement these and many more investment strategies in my Henrique Wealth Academy — check it out for free.
— Henrique Centieiro 🕺🏻
If you found any value in this article, throw me some love!
🥰 What you can do to support my work:
Clap up to 50, leave a message to share your thoughts &
be sure to follow. 💌
🌞 Stay in touch:
Achieve Financial Freedom: Wealth Education, Crypto & Investment Strategies | Linktree
Unlock your financial potential with expert insights on stocks, crypto, and ETFs. Join me today to start your journey…
linktr.ee