A practical look at cutting friction across networking, data debugging, testing, and AI-assisted workflows

Friction in everyday iOS development
In many iOS projects, development is not slowed down by missing knowledge or expertise, but by friction in everyday workflows. Most teams underestimate how much time is lost on things that have nothing to do with writing actual code. Waiting for backend changes, debugging inconsistent data states, or dealing with repetitive test setups are not edge cases, they are daily reality in most projects. From what we’ve seen, productivity is less about individual knowledge and more about how messy or clean your workflow actually is. And in many cases, it’s messier than people admit. In this article, we’ll show some of the tools and practices we use in our daily work to reduce this friction in production apps.
Is the backend really blocking you?
One of the most common friction points happens before you even fully start implementing a feature. Often the mobile frontend is waiting for new API changes to implement the newest features. In meetings, we often hear blockers like “at the moment the ticket is blocked because the API is not ready yet”. In most cases, this is not actually a real blocker, it just feels like one.
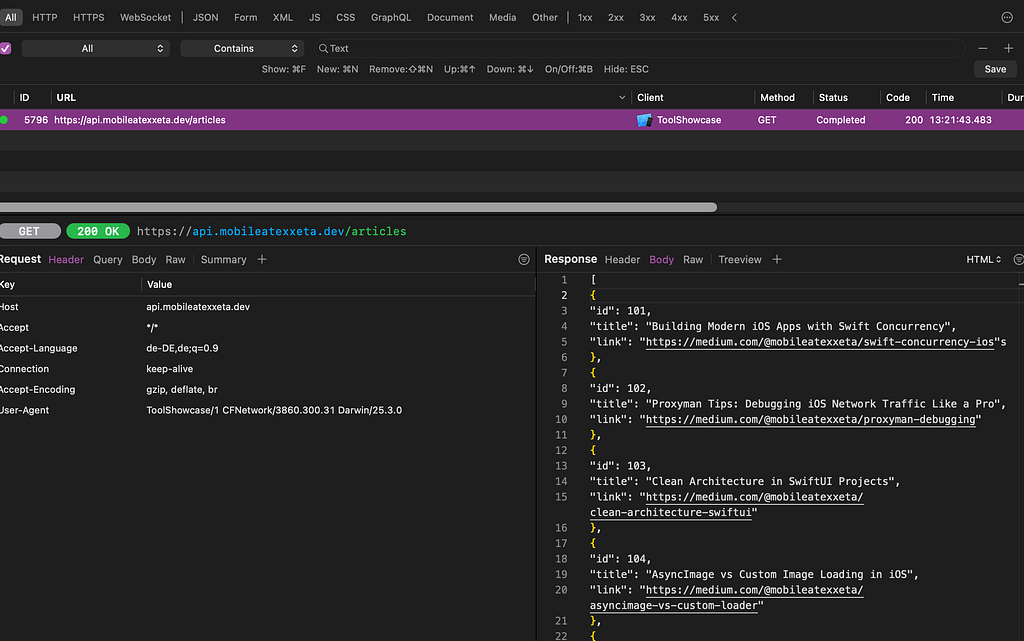
For debugging network traffic, we use Proxyman. It allows us to inspect requests and responses and adjust them when needed. This means we can continue building and testing features even if the backend is not fully ready yet. One useful tool here is Map Local, which enables us to adjust responses for an URL. This helps simulate real backend behavior directly on the device.
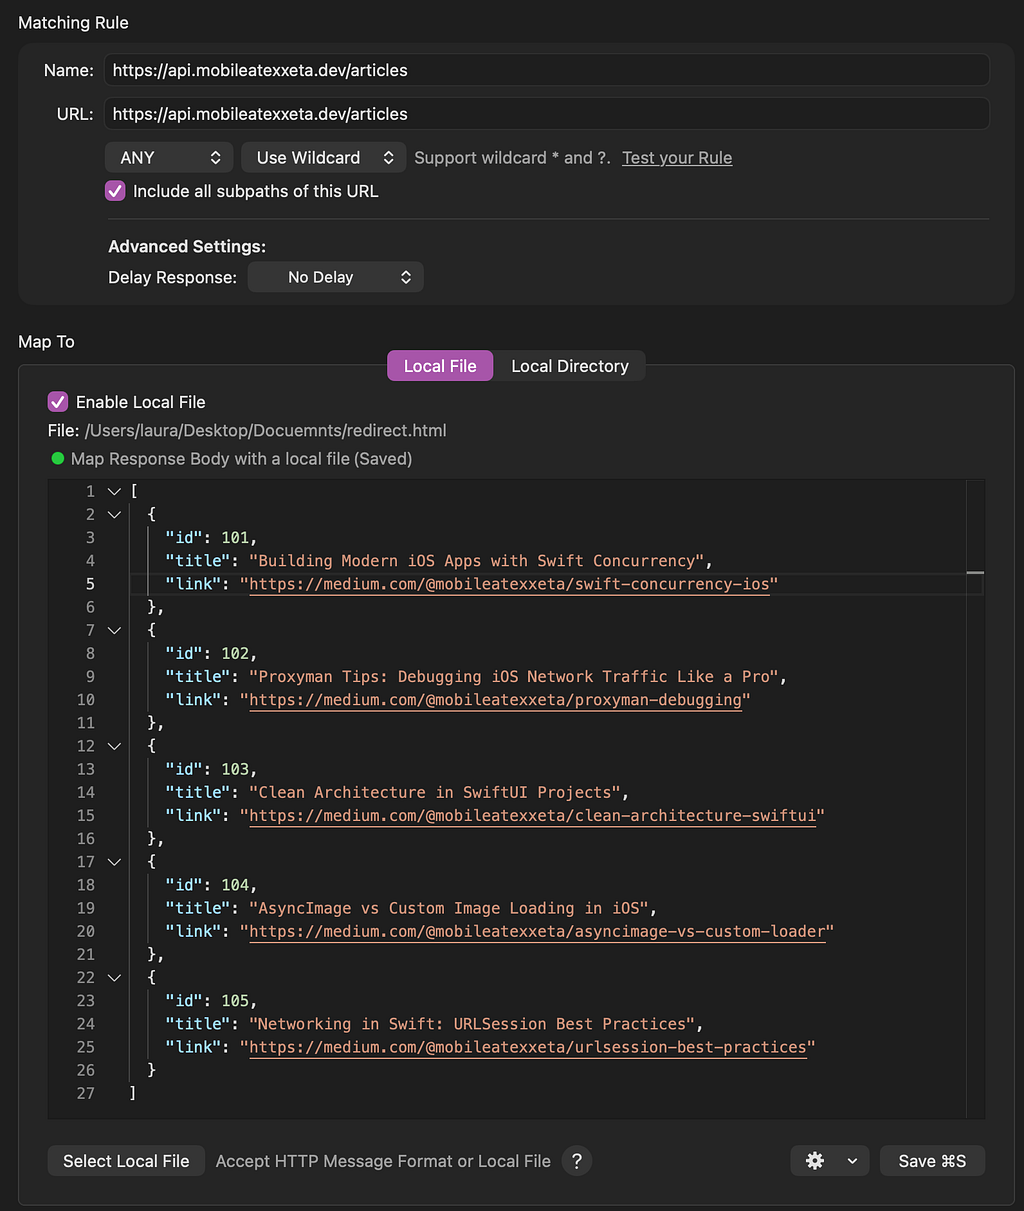
This unblocks development on the frontend side but even unlocks the quality testers of apps to test the app without waiting for the backend changes. With this the ticket is none of the ticket states blocked.
Are you debugging Core Data or just guessing the current state?
Another place where friction builds up is not the network, but the local data state. When working with Core Data, it’s often not immediately clear what is actually stored in the database at any given moment. You end up logging objects, printing relationships, and trying to make sense of long debug output. Most of the time, that quickly becomes more confusing than helpful.
For this, we use Core Data Lab. It gives a direct view into what is stored in Core Data, including relationships between entities, without having to reconstruct everything from logs.
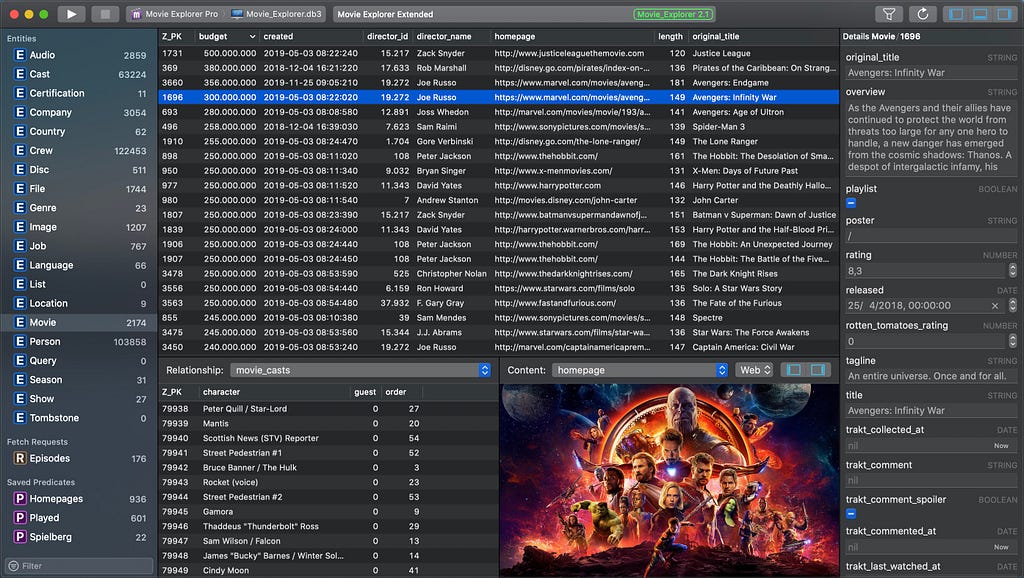
This makes it much easier to understand what is actually happening inside the database. It helps us to save time and also quickly give everyone the same understanding of the data which is lying in Core Data when discussing bugs.
Why are you still doing manual Jira updates and fastlane steps in 2026?
Friction does not only happen on the technical side. It also shows up in our daily workflow tools. When working with Jira, Azure DevOps, or similar tools, development workflows often include a lot of small manual steps between states. One that always annoyed us was the “ready for testing” phase. Moving a ticket there usually meant updating the status, changing the assignee, adding a comment, and attaching the correct test build link. Individually, none of this is hard, but over time it becomes a repetitive task that slows down both developers and testers.
To reduce this friction, we improved the workflow using Jira automation rules together with fastlane. Instead of doing everything manually, the pipeline now takes care of it: it reads the Jira ticket number, gets the correct build version, and triggers a Jira action that moves the ticket forward, updates the assignee, and adds the test information automatically.
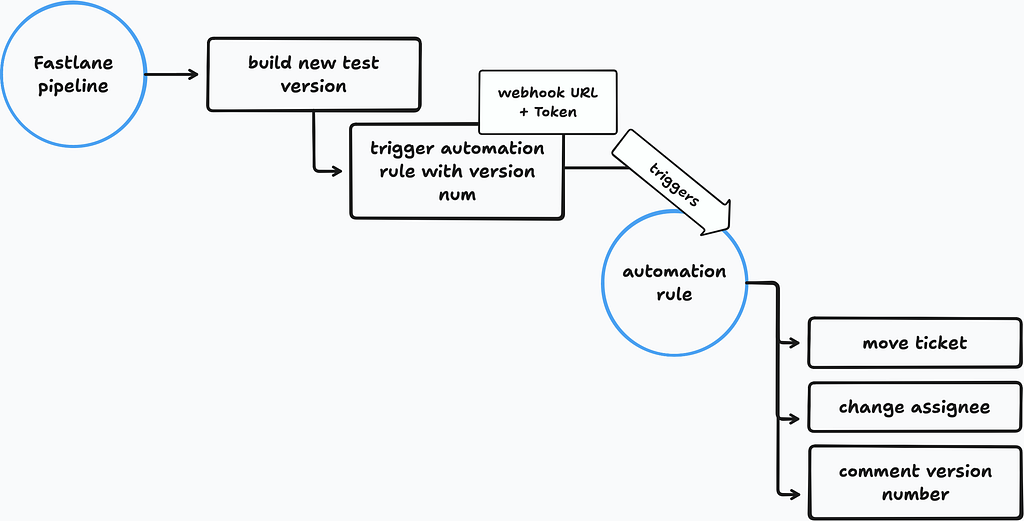
This removed a lot of manual steps for both developers and testers, since tickets are now updated automatically once a build is ready for testing and stops dialogs like “oh no sorry I forgot to move the ticket to be tested, you can start testing” in the daily.
Does snapshot testing still feel manual in SwiftUI projects?
Snapshot testing is a good example of something that is useful but quickly becomes repetitive in practice. If you use snapshot testing with Point-Free’s framework, you probably know how repetitive it gets to write the same structure over and over again. The tests themselves are useful but writing them does not really feel efficient, especially when you are just repeating the same patterns across different views.
This is where Prefire helps to reduce some of that friction. It can generate snapshot tests from SwiftUI previews, which makes it easier if you are already using previews as part of your development flow. So instead of manually writing all snapshot test cases, you get a starting point generated from your existing UI setup.
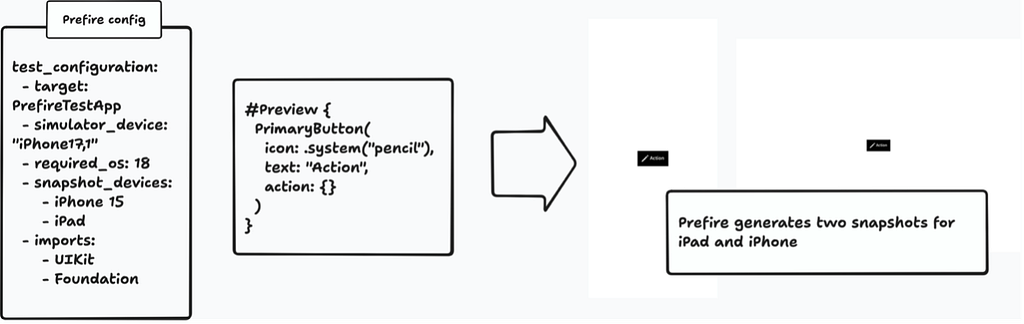
There are still some limitations, especially around things like consistent Light and Dark mode handling in tests, but overall, it already removes a good amount of repetitive work.
In times of AI, most people already know the basics like using agents for coding, implementing tickets, or generating tests, so we’ll skip that and focus on something a bit more interesting.
How much time do you lose fixing the AI build loop instead of coding?
When working with AI tools like copilot in combination with Xcode one recurring issue is that the generated code often does not compile on the first try, which creates a new kind of friction. You run the build, get errors, copy the logs, go back to copilot, explain what failed, try again and end up in a loop where you are basically acting as the bridge between compiler and AI.
With XCodeBuildMCP, this loop becomes more efficient. It connects build output directly into the AI workflow, so instead of manually copying logs back and forth, the system can access build results and use them for the next iteration. This reduces a lot of the back-and-forth when working with AI-generated code that is close to working, but not quite there yet.
This saved us a lot of time when we started working with AI. In the beginning, we ran an experiment where we simply handed a Jira ticket to our configured Copilot and let it implement the entire feature. Very quickly, we became frustrated by how often the generated code failed to compile. After installing XCodeBuildMCP, this stopped being an issue, and we were able to focus on our actual work instead of fixing build loops.
Do you still waste time by understanding crashes instead of fixing them?
Another recurring source of friction is the following situation which every developer knows: complex logs, unclear stack traces, and bugs that are hard to reproduce or even understand properly. You fix one thing, then another, but nothing really changes, and you end up losing time just trying to figure out what the actual issue is. With AI tooling, there are now some interesting ways to improve this workflow. If you use tools like Firebase Crashlytics or Sentry, you can connect them via MCP and let an AI assistant analyze the crash data directly. (Firebase MCP, Sentry MCP)
For example, instead of manually digging through logs, you can ask something like: “What is the most frequent and critical crash in this app?” The MCP can then summarize the issue, highlight patterns, and in some cases already suggest possible root causes.
Of course, this only works well if your setup is properly configured with the right context and permissions otherwise the results will be too noisy to be useful.
In one of our projects, this already helped us identify and prioritize one of the most recurring bugs much faster than doing it manually.
Looking ahead, this could even be extended further for example automatically detecting issues, suggesting fixes, or creating merge requests directly from analyzed crashes. We also see similar potential in other areas like PR review or automated test suggestions, but crash analysis MCP is one of the most interesting tools at the moment for us.
Conclusion
If you look at all of these tools together, they all solve the same type of problem: friction in everyday iOS development. Some of them help us deal with missing or incomplete backend systems, some make debugging more transparent, and others reduce repetitive manual work that builds up over time.
More recently, we also see AI starting to remove friction in areas that used to be fully manual, especially around debugging, build iteration, and crash analysis. Not everything needs to be automated, and not every workflow benefits from AI. But it’s becoming harder to ignore that a lot of small inefficiencies in mobile development are slowly getting addressed.
For us, the interesting part is not the individual tools themselves, but how they change the way we work day to day. What is your favorite tool or process to remove friction in everyday iOS development? (By Laura Siewert)
The hidden costs of iOS development and how we removed it was originally published in Level Up Coding on Medium, where people are continuing the conversation by highlighting and responding to this story.