The Day Average Line: A Simple Intraday Edge in TradingView
--
//@version=5
indicator(“Day_Avg”, shorttitle=”Davg”, overlay=true)
var float sum_close = na
var int count = na
new_day = ta.change(time(“D”))
if (new_day)
sum_close := 0
count := 0
sum_close += close
count += 1
day_avg = sum_close / count
plot(day_avg, color=color.blue, title=”Day Average Line”, linewidth=2)
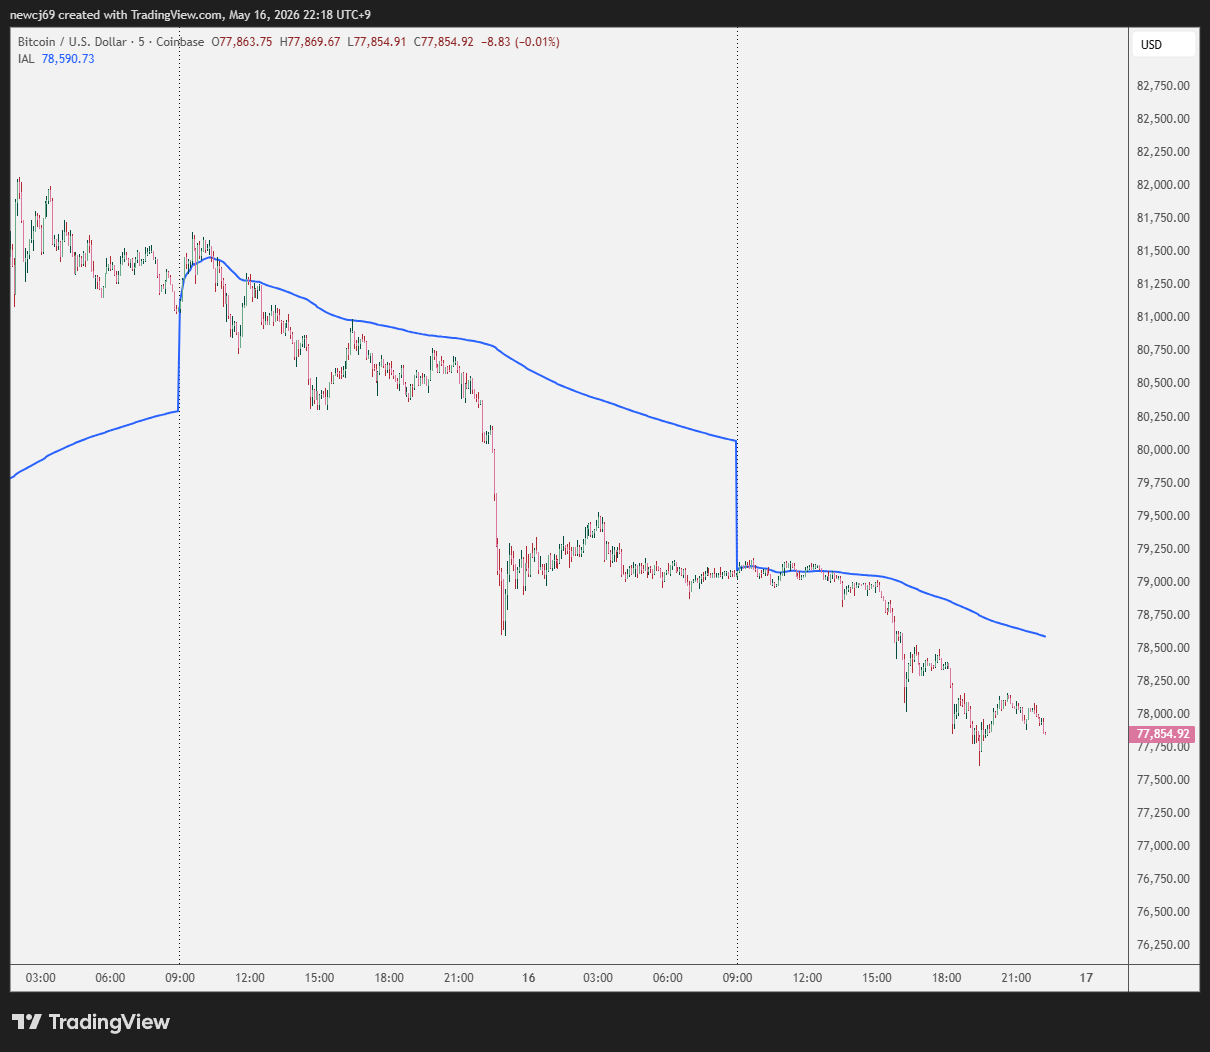
What is the Day Average Line?
The Day Average Line is the average price of the current trading day.
“While it functions similarly to a 1-day moving average, it doesn’t wait for the daily candle to close. Instead, it calculates the average price dynamically throughout the day using intraday bars.
In simple terms, it unfolds the current daily candle into smaller timeframes and continuously calculates the mean price.”
Why is it useful?
This line acts as an intraday equilibrium level.
When price is above it, the market is trading above the day’s average price.
When price is below it, the market is trading below the day’s average.
This makes it useful for:
- spotting mean reversion opportunities
- identifying short-term trend strength
- measuring intraday price imbalance
One interesting feature
The Day Average Line looks identical across different timeframes.
Whether you view:
- 1-minute
- 5-minute
- 15-minute
- 60-minute charts
the line remains the same.
That makes it a very stable intraday reference.
TradingView advantage
For Korean stocks, TradingView free accounts have delayed market data, which limits real-time use.
However, this indicator works very well for:
- crypto markets
- U.S. stocks
- futures
- 24/7 markets
And unlike many local HTS scripting environments, one Pine Script works across all markets without requiring separate session-specific logic.
Sometimes, the simplest tools provide the clearest market perspective.
The Day Average Line is one of them.