The 2026 economic crisis anatomy, real estate and crypto impact, and opportunity playbook
 George Alex Popescu15 min read·Just now
--
Nasdaq closed down 10.5% from its top recently in bear market territory. Oil is above $100 and may increase to $150 for the next six months perhaps. The private credit $2 trillion market is imploding with redemption freezes. The bond market is up with interest rates in the 5% range. And job creation has been flattish for the last year or so.
Is there a crisis looking at the horizon ?
PART 1: WHAT DOES THE CRISIS LOOK LIKE
This isn’t a 2008-style bank run. It’s a stagflationary credit crisis with four converging shocks acting simultaneously.
The Private Credit Implosion
As of late March 2026, a confluence of stagnant interest rates, an “exit logjam” in private equity, and a sharp spike in borrower defaults has begun to grind the once-unstoppable private financing flywheel to a halt. The U.S. Private Credit Default Rate has hit 5.8% in early 2026, with Morgan Stanley warning of a spike toward 8%. The crisis is defined not by headline bankruptcies but by a quieter trend: distressed exchanges accounted for 94% of all private credit downgrades in the twelve months leading up to March 2026 — arrangements involving payment-in-kind toggles where interest is added to principal rather than paid in cash.
The liquidity crunch is now visible: Ares Management capped redemptions in its $10.7 billion private credit fund at 5% after withdrawal requests surged to 11.6%. Other managers including Blue Owl and Cliffwater have also scrambled to halt or restrict withdrawals. The “exit logjam” — where private equity firms are holding companies for an average of six years because they cannot find buyers — has turned the private credit market into a closed loop where no capital is being returned to Limited Partners.
The Oil Shock / Stagflation Trap
Oil above $100 raises costs, revives inflation, freezes central banks, and pressures weak balance sheets. The Iran war blocked the Strait of Hormuz, and gas prices jumped ~27% in four weeks, adding roughly $740/year in extra fuel costs for the average household.
This is the key macro trap: the Fed cannot cut rates to rescue credit markets because inflation is re-accelerating. The Fed will not cut rates because of private credit stress, but it will cut if that stress morphs into tighter credit or weaker consumption. The more important question is whether rate cuts can solve a problem that is, at its core, about credit quality rather than the costs of borrowing.
The AI Concentration / Nasdaq Unwind
The Nasdaq -10.5% from peak is just the beginning of a potential unwind. With stock markets trading at recent highs, growing concerns about an emerging bubble in the AI sector and continued uncertainty around trade policy mean investors are on a hair trigger for any signs of a potential market crash. Private credit has significant exposure here: software exposure in direct lending is estimated at around 26% according to Morgan Stanley, with fears that agentic AI could disrupt the software-as-a-service model underlying many borrowers.
The Crisis Shape: Stagflation, Not Depression
This looks more like 1973–74 or 1980 than 2008. Key differences from 2008: private credit sits largely outside the banking system in private funds with locked-up capital — meaning there are no depositors to run and no re-hypothecation of assets at the same scale. But energy price shocks create complex labor market effects. Traditional Phillips Curve relationships between unemployment and inflation break down during supply shocks, as demonstrated during the 1973 oil crisis when 11% inflation coincided with 6% unemployment. That’s the real risk — stagflation that paralyzes policy response.
PART 2: WHAT CAN WE LEARN FROM HISTORY?
What can we learn from the 1973–74 and 1980s crisis that were most similar to present conditions ?
There is great historical research to draw from. Here’s a clean comparison of both crises, and what they tell you about today.
THE 1973 — 74 CRISIS
What triggered it
On October 19, 1973, immediately following President Nixon’s request for Congress to make available $2.2 billion in emergency aid to Israel for the Yom Kippur War, the Arab oil-producing nations instituted an oil embargo on the United States. These cuts nearly quadrupled the price of oil from $2.90 a barrel before the embargo to $11.65 a barrel in January 1974.
But the oil shock was the match, not the powder keg. While the rise in inflation in the 1970s is usually associated with the 1973 — 74 oil price shocks, inflation had already exceeded 7% before the first sign of an oil crisis in October 1973. The root causes were deeper — rooted in the collapse of the Bretton Woods exchange rate system in 1971, unprecedented monetary expansion, and the costs of funding the Vietnam War.
The market collapse
In the 694 days between January 11, 1973 and December 6, 1974, the Dow Jones Industrial Average suffered the seventh-worst bear market in its history, losing over 45% of its value. The loss of stockholder wealth amounted to $525 billion, or 43 percent — the longest and steepest fall in corporate stock prices since the Depression of the 1930s.
The high-flying growth stocks of the era — the “Nifty Fifty” — were obliterated. These stocks had traded at an average P/E ratio of 41.9 times earnings by late 1972. Xerox fell 71%, Avon 86%, and Polaroid 91% from their 1972 — 73 highs to 1974 lows. Notice any parallels to today’s AI concentration?
The economic damage
In the US, unemployment climbed from 4.6% in October 1973 to 9% by May 1975 while GDP contracted by 0.5% in 1974. US inflation hit 12.3% in 1974, up from 3.4% in 1972.
The policy trap
Monetary policy cannot offset the recessionary and inflationary effects of increased oil prices at the same time. If the central bank lowers interest rates in an effort to stimulate growth, it risks adding to inflationary pressure; but if it raises enough to choke off the inflationary effect, it may exacerbate the slowdown in economic growth. The Fed in 1973 — 74 chose to err toward stimulus, which postponed the inflation fight and made the 1980 crisis necessary.
How long the pain lasted
The recovery was a slow process. The United States did not return to the same real market level until August 1993 — over twenty years after the 1973 — 74 crash began. In nominal terms it took until 1987. Investors who sat frozen through the crash missed the enormous 1975 — 76 rebound: funds like American Century Growth shot up 42.5% in 1975 and 61.1% in 1976. Chuck Royce of Pennsylvania Mutual earned a phenomenal 121.1% in 1975 and another 49% in 1976.
THE 1979 — 82 CRISIS (THE VOLCKER SHOCK)
What triggered it
The 1973 crisis was never fully resolved — inflation was merely suppressed. A second oil shock from the Iranian Revolution in 1979 reignited it. The first Arab oil embargo in 1973 quadrupled crude oil prices to a plateau that held until the Iranian revolution brought a second energy crisis in 1979. The second crisis tripled the cost of oil. By summer 1980, inflation was near 14.5% and unemployment was over 7.5%.
The Volcker response — deliberate pain
Paul Volcker was appointed Fed Chair in 1979 specifically to break inflation. His approach was radical and unprecedented. Fed funds rates rose to over 20%. Ten-year Treasury notes to over 15%. Thirty-year fixed rate mortgage rates rose to over 18%. The prime rate reached 21.5%.
Farmers protested at the Federal Reserve’s headquarters, and car dealers sent coffins containing the car keys of unsold vehicles to the Fed. Many people wrote to Volcker telling him they had saved for years to buy a home but were now unable to because of high rates.
The housing destruction
This is the most relevant parallel for your real estate focus. Volcker allowed the fed funds rate to rise over 20%, and with it went the interest on home mortgages and everything else — turning the housing market into a nightmare for both buyers and sellers. It was common in that era for sellers to help buyers by letting them assume their existing mortgages because no one could afford new ones at 18%.
The economic damage
The second recession sparked by these hikes was far deeper than the 1980 recession, with unemployment peaking at 10.8% in December 1982, the highest level since the Great Depression. Long-term interest rates continued to rise even as the recession deepened — the 10-year Treasury bond rate increased from about 11% in October 1980 to more than 15% a year later, because the market believed the Fed would back down from its tight policy when unemployment rose. It didn’t.
The cure
Inflation rates dropped from a peak of around 14.8% in March 1980 to around 3.8% by 1983, restoring credibility to the Federal Reserve and laying the groundwork for sustained economic growth and stability in the subsequent decades. The year 1982 also saw the start of the two-decade bull market in stocks, and the 40-year bull market in bonds.
THE KEY LESSON FOR TODAY
The 1973 crisis is the better analog for the crash phase — a sudden supply shock colliding with overvalued growth stocks and a Fed that’s paralyzed. The 1973 — 74 oil shock recession had a devastating effect on stock prices. Conversely, persistent inflation thereafter helped corporate earnings tremendously. If a savvy investor had been out of equities in 1973 — 74 but otherwise fully invested from 1970 to 1982, they would have very handily beaten inflation during an otherwise stagflationary period.
The 1980 crisis is the better analog for the resolution — if this oil shock persists and the Fed eventually has to crush demand to kill inflation, you’d see mortgage rates spike to levels that freeze real estate transactions entirely, even if nominal prices don’t collapse. Properties wouldn’t lose value so much as become un-sellable and un-financeable — which is actually the buying opportunity for all-cash or lightly leveraged buyers sitting on the sidelines.
The critical takeaway: both crises rewarded patience and punished leverage. The investors who won were those who held cash or hard assets through the crash, then bought aggressively at the bottom when everyone else believed things would never recover.
What could we or should we do to prepare or take advantage of this crisis? The real estate market seems a good defensible position, especially in regions that are diverse and rich.
PART 3: NORTHEAST MULTIFAMILY — THE SURPRISING NUANCE
Northeast multifamily is actually the most defensible real estate asset in this scenario, with one critical exception.
Why Northeast Multifamily Holds Up
The Northeast was marked by limited new supply in 2025, which led to above-average rent growth. That trend is projected to continue in 2026, leading to rent growth in the 4% — 5% range annually. Metros such as New York, Philadelphia, and Hartford are experiencing some of the tightest occupancies in the country — Hartford and New Haven entered 2026 with vacancy rates below 1%.
Rents are increasing modestly in low-supply markets in the Northeast and Midwest and decreasing in many high-supply markets in the Sun Belt and West. The structural reason: New York City and Chicago have only added 1 — 2% to stock in recent years and are seriously undersupplied, while construction starts have fallen off a cliff nationally.
The Countervailing Forces in a Recession
In a true stagflationary recession, three things happen to Northeast multifamily:
1. Cap rate expansion — if 10-year treasuries stay elevated (4.5 — 5.5%) due to sticky inflation, cap rates could re-rate from ~5.7% to 6.5 — 7%, compressing values 10 — 20% even if NOI holds flat
2. Rent growth slows but stays positive — renters can’t afford to buy homes (mortgage rates spike), so demand stays strong, but wage growth lags inflation, capping rent increases
3. Transaction volume freezes — debt markets seize, forced sellers emerge, creating distressed opportunities by late 2026/early 2027
The biggest risk for real estate in 2026 is not an instant price crash, but “high interest rates lasting longer than expected.” The real killer for real estate is interest rates, not oil prices themselves.
Verdict: Northeast multifamily values likely fall 10 — 20% on a mark-to-market basis driven by cap rate expansion, but NOI/cash flow holds or grows modestly. This creates a disconnect between price and income — which is the opportunity.
And de facto how would somebody take advantage of this ?
PART 4: HOW TO TAKE ADVANTAGE
Tier 1 — Immediate (Now through Q3 2026)
∙ Build cash / short duration assets. T-bills at 4 — 5% while volatility shakes out distressed sellers. The crisis hasn’t fully priced into transaction markets yet — private credit gates are only weeks old.
∙ Short or hedge AI concentration. The Magnificent 7 / AI concentration unwind could be -30 to -50% from peak. Put spreads on QQQ or sector ETFs.
∙ Buy gold / energy / commodities. Hard assets are seeing renewed investor interest as inflation fears surge — the Iran war is accelerating demand across the board.
Tier 2 — Mid-Crisis (Q3 2026 — Q1 2027)
∙ Target distressed Northeast multifamily. The window opens when: (a) overleveraged sponsors face loan maturities they can’t refinance, (b) private credit lenders force asset sales, (c) transaction volume picks back up. Properties with floating-rate bridge loans originated 2021 — 2023 are the most vulnerable — many are hitting maturity walls right now.
∙ Focus on 20 — 100 unit buildings in supply-constrained NJ/CT/Westchester rather than NYC (regulatory risk). These trade at premiums to replacement cost but with organic rent growth of 4 — 5%, a well-priced acquisition at a 6.5 — 7% cap rate delivers strong risk-adjusted returns when rates eventually normalize.
∙ Distressed debt / preferred equity. Rather than buying properties, consider providing rescue capital to stressed sponsors at 12 — 15% preferred returns secured by the asset. A new cohort of distressed and opportunistic credit funds has raised more than $100 billion over the past two years to capitalize on resulting volatility. You can do a version of this at the individual deal level.
Tier 3 — Recovery Play (2027+)
∙ Development sites in Northeast. New construction starts of rental housing developments are down 70% from peak. The supply drought setting up for 2027 — 2029 deliveries means today’s ground-up development — if you can finance it — captures the next upcycle with minimal competition.
∙ 1031 exchanges into beaten-down assets. If you sell anything into a brief market recovery, defer gains into distressed multifamily acquisitions.
The Single Most Important Tactical Point
Given we’re evaluating Northeast multifamily (and potentially CT specifically), the playbook is: don’t buy at today’s prices, but get ready to move fast in late 2026. The distressed window in Northeast multifamily will be narrow — maybe 12 — 18 months — because the structural undersupply means values recover quickly once rates stabilize. The buyers who win will be all-cash or lightly leveraged, moving when overleveraged 2021-vintage deals hit maturity walls and sponsors have no options.
The worst thing to do right now is buy with floating-rate debt, own heavily levered equity in AI stocks, or be sitting in illiquid private credit funds. The best thing is liquidity + patience + a specific target market where you know values well.
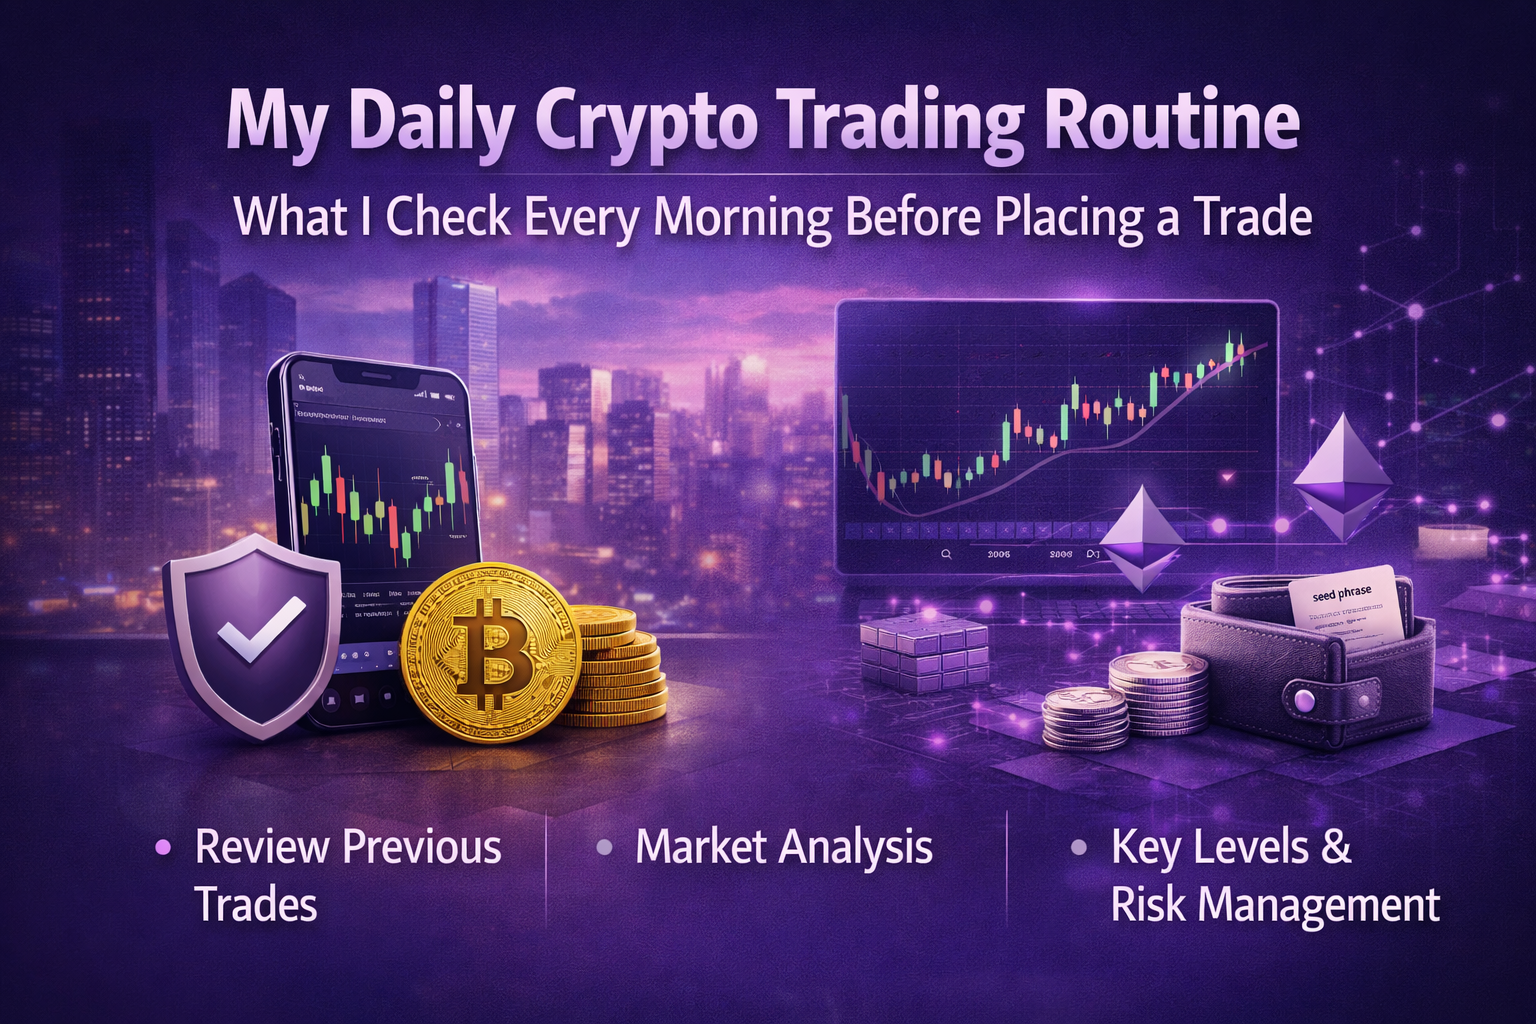
PART 5: WHAT ABOUT THE CRYPTO MARKET?
This is a genuinely fascinating question because crypto in 2026 is facing something it has never faced before. Here’s a structured, honest take.
THE FUNDAMENTAL PROBLEM: CRYPTO HAS NO STAGFLATION PLAYBOOK
Every prior crypto bear market happened in one of two environments: either a pure risk-off tech selloff (2018, 2022) or a brief deflationary shock followed by massive stimulus (Covid 2020). Outside of the two-month recession around the Covid pandemic, crypto has never experienced any legitimate economic downturn. The mortgage-fueled Great Recession from 2007 to 2009 preceded Satoshi Nakamoto launching the Bitcoin network. Stagflation — the specific cocktail of slow growth + sticky inflation + no Fed rescue — is completely uncharted territory for the asset class.
WHERE WE ARE RIGHT NOW
The damage has already started. Bitcoin reached a new all-time high going into 2026, then pulled back sharply — currently sitting 47% below that peak. The Fear & Greed Index has remained in “Extreme Fear” territory for 46 consecutive days, scoring as low as 5 out of 100.
Ethereum is now trading at around $1,900, more than 50% below its August 2025 peak, while Bitcoin is down around 25% year-to-date. The proximate causes: a 15% global tariff shock triggering inflation fears, Iran-US military escalation causing $300M in forced liquidations in a single day, AI-driven tech sector anxiety, Federal Reserve rate cuts being pushed back, and a record $13.5 billion derivatives expiry on March 27.
THE CRITICAL FORK: RISK ASSET OR DIGITAL GOLD?
This is the single most important question for crypto in this crisis. Bitcoin’s fate depends entirely on which identity wins out.
The bearish case — Bitcoin as high-beta risk asset
If growth slows while inflation stays sticky, the central bank is boxed in. In that setting Bitcoin can either behave as a high-beta risk asset and sell off with equities, or as a macro hedge if institutional investors decide that fiat policy is structurally impaired. Which regime dominates in 2026 will decide whether the asset trades closer to the optimistic six-figure targets or to the defensive mid-five-figure ranges.
The bearish transmission mechanism is straightforward: if the Federal Reserve is forced to maintain tight monetary policy to combat energy inflation, the US dollar will strengthen, draining liquidity from the crypto ecosystem. As a high-beta asset, Bitcoin will initially suffer a severe, correlated drawdown alongside traditional equities as leveraged players are wiped out.
The bullish case — Bitcoin as digital gold / stagflation hedge
Something unusual is already happening. Bitcoin has gained roughly 8% since the US-Iran war began. Gold is down. The S&P 500 is down. Asian equities had their worst stretch since 2020.
And institutional money is not fleeing. Bitcoin is down 20% year-to-date and sentiment is at extreme fear, yet Bitcoin ETFs just posted $1.53 billion in inflows over four straight weeks — the longest positive streak of 2026. This is a structurally new dynamic that didn’t exist in 2018 or 2022.
THE MOST LIKELY SCENARIO: A TWO-PHASE CRISIS
Phase 1 — The Flush (Now through Q3 2026)
In the immediate aftermath of the oil spike, global risk assets face indiscriminate selling. Bitcoin will initially suffer a severe, correlated drawdown alongside traditional equities as leveraged players are wiped out. The key levels to watch: if Bitcoin holds above the $70K–$72K range and ETF inflows continue, it suggests institutions are positioning for a stagflation hedge. If that range breaks to the downside alongside weakening flows, macro pressure is winning and Bitcoin is trading as just another risk asset.
The bearish tail for Bitcoin in a hard recession is sobering: the bearish tail, driven by a hard landing, policy error, or a reversal in ETF appetite, runs back through $70,000 and into the $50,000s, with low-probability stress cases in the $25,000–$10,000 zone if panic or a policy crackdown returns.
Phase 2 — The Narrative Shift (Late 2026 / 2027)
This is where it gets interesting for a patient investor. As stagflation deepens, the fragility of the fiat system becomes undeniable. When institutions realize the physical limitations of moving and settling gold globally, Bitcoin’s core value proposition — absolute scarcity, decentralization, and borderless transferability — will be fully activated. After surviving the initial liquidity crisis, BTC will absorb massive inflows of capital fleeing depreciating fiat currencies, firmly establishing its macroeconomic status as “Digital Gold.”
The Covid analog supports this: Bitcoin skyrocketed more than 900% in the quarters following the 2020 recession, jumping from below $7,000 to as high as $69,000. “Not only will high-quality projects survive, but they will thrive in the easy money policies that follow.” The key difference is that in stagflation, the “easy money” phase may come much later and less aggressively than in 2020, because the Fed’s hands are tied by inflation.
BTC vs. ETH: VERY DIFFERENT STORIES
This crisis will likely drive a massive divergence between Bitcoin and altcoins.
Bitcoin has a credible dual narrative — either it survives as digital gold or it recovers as a risk asset in the eventual rebound. Its structural supply constraints are real: Bitcoin exchange reserves are at their lowest levels since 2018. More than $50 billion flowed into spot Bitcoin ETFs over the past year, and most of that capital has remained in the market. Asset managers increasingly view Bitcoin as a strategic allocation rather than a short-term trade.
Ethereum and altcoins are much more vulnerable. During a global recession triggered by high oil, retail disposable income will evaporate and enterprises will slash technological development budgets, guaranteeing a cliff-edge drop in speculative on-chain activity. Wall Street pricing models classify Ethereum as a high-growth technology stock. When the macro economy stagnates and corporate earnings collapse, the tech sector is historically the first to be liquidated. ETH will struggle to attract the safe-haven premium afforded to Bitcoin, instead facing prolonged valuation compression and network stagnation until the broader economic cycle recovers.
THE PLAYBOOK FOR A CRYPTO INVESTOR IN THIS CRISIS
Phase Action Now (crash phase) Reduce leverage to zero. DCA into BTC only, not altcoins. Watch the $70–72K support. If BTC breaks $60K Likely means risk asset narrative is dominating — wait. Cash is king. If BTC holds $70K+ Institutions are treating it as stagflation hedge — accumulate slowly Late 2026 / 2027 bottom Aggressive accumulation across BTC, ETH, quality L1s Recovery phase Altcoin season follows BTC recovery with 6–12 month lag
The honest bottom line: Bitcoin’s identity crisis is the crisis within the crisis. If it proves itself as a store of value during a stagflationary shock, the long-term price appreciation from that regime change would be enormous — potentially more significant than any prior cycle. If it fails that test and trades purely as a tech stock, expect $40–50K before the eventual recovery. Either way, the opportunity for a patient, unleveraged investor is meaningful. The risk for a leveraged or altcoin-heavy investor is potentially catastrophic.