Stop Guessing the Open. Let the History Tell You.
--
I’ve been trading the open for years, London and New York, and the one thing that always frustrated me was this: you can spend hours studying how price tends to behave in certain conditions, build a solid read on the market, and then sit down in front of a live chart and feel like you’re starting from zero. The context is gone. You’re reacting.
RetroVis is my attempt to fix that.
The idea
Every session has happened before. Not exactly, but close enough that history has something useful to say. The market opens in a certain relationship to yesterday’s range, volatility starts showing its hand, and if you could instantly see how the market behaved the last hundred times it found itself in a similar situation, you’d have something concrete to work with instead of just a gut feeling.
That’s what RetroVis does. It searches 20 years of historical data in real time and surfaces how comparable sessions actually played out, with numbers: how far price typically ran in either direction, where it tended to sit at the end of the session, where it was after the first hour. Everything normalized so it makes sense regardless of where the market is trading today.
It runs in two modes, and they answer slightly different questions.
Context Matches looks at the broader picture before and around the open. Where did price start the session relative to yesterday’s range? How is today’s range developing? It finds historical sessions that opened in a similar situation and shows the distribution of outcomes. This is the first thing I check when I sit down.
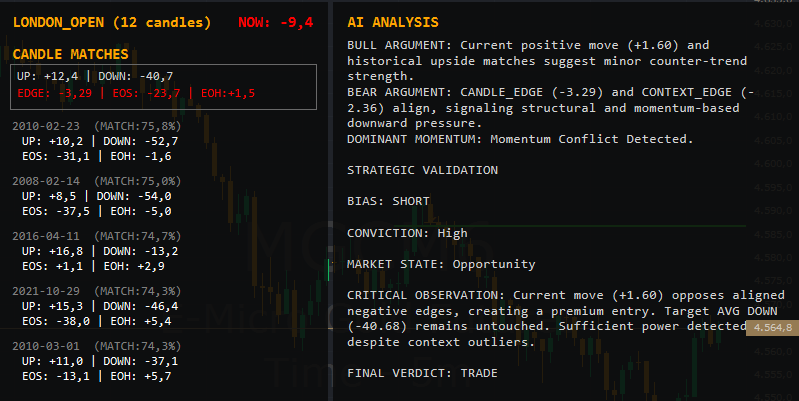
Candle Matches is more dynamic. It updates continuously throughout the session, tracking how price is actually moving from the open, bar by bar. As the session develops, it searches for historical sessions that unfolded in a similar way up to that point. It adjusts as new information comes in, so the picture evolves with the market rather than being fixed at the open.
The AI layer
Every search also gets passed to Gemini for a quick read on the data. Not to make decisions, but to flag things that are easy to miss when you’re focused on the chart: historical sessions in the matched set that are outliers and skewing the averages, situations where the two modes are telling conflicting stories, or cases where the historical sample looks clean on the surface but isn’t.
It’s a second pair of eyes on the numbers, one that doesn’t have a directional bias but is useful for keeping you honest about what the data is actually saying.
Who this is for
I built this for myself. I trade the open every day and I needed something that could give me real statistical context while I was actually in the session, not after the fact.
If you trade London or New York open, work with session levels, and already think about the market in terms of tendencies rather than signals, this will probably click for you immediately. If you’re looking for something that tells you when to buy and sell, this isn’t it.
RetroVis doesn’t predict anything. It shows you what happened in comparable situations, gives you a statistical read on the tendencies, and leaves the decision to you. That’s the point.
I show it live every day on YouTube, one session for London and one for New York. That’s probably the easiest way to get a feel for how it works in practice. If you have questions or anything isn’t clear, drop them in the comments here or on YouTube, I read everything.