We all have heard of this:
“Invest ₹10,000 every month in a SIP for 20 years and become a crorepati!”
This is often supplemented by a chart showing how your ₹24 lakh investment grows to almost ₹1 crore — thanks to the “eighth wonder of the world” — the power of compounding.
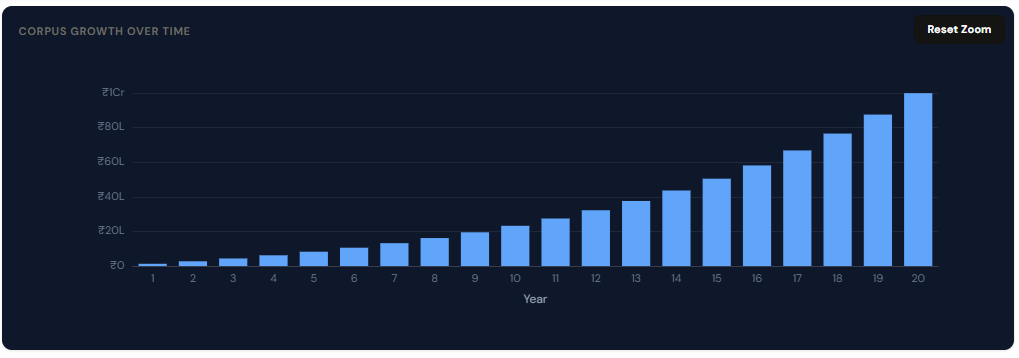
The final corpus number is sufficiently motivating for people to start a SIP — cherry on the top “Mutual Funds sahi hai” campaign confirms your belief!
But, this is an oversimplification of what actually happens behind the scenes. This post is about understanding what SIP really is, how compounding works in practice, and what mindset you need to stay invested through the inevitable ups and downs in the market.
What SIP Actually Is?
Let’s start from the beginning.
SIP stands for Systematic Investment Plan. — SIP is NOT an investment product. It’s a method of investing.
The name itself is descriptive enough, however, I have seen people missing out on the complete definition.
Lets break it down word by word:
Systematic: Anything that is — Planned. Consistent. Repeated. — The literal meaning of this word says “acting according to a fixed plan” — so yes, when you set up an auto-debit instruction (for your SIP amount to be transferred from your bank to the broker/AMC) every month — you have created a system.
Investment: The way I look at investment is that it is always done for a “deferred consumption” — we all invest to ultimately consume it at a later date. The consumption can be either by us or by our family members.
Plan: This is where most people stop thinking! — They invest but without a plan. — We will cover this later in the article.
For now, lets see How our money grows when we invest through SIPs?
Whenever we want to see how much will our SIP grow in 10 years, we use some return % . Example: ₹5000/month over 10 years at 12% p.a. will give ~50 lakhs.
Here, 12% is the CAGR i.e. compounded annual growth rate. — It assumes that the corpus will grow every year by 12% and corpus includes the growth accrued in a year — so that's the compounding part — 12% is not the simple interest, but compound interest — you earn interest on interest.
But, this is not what really happens.
Money doesn't compound Year on Year in a SIP!
What drives SIP Returns?
Lets consider SIP in “Mutual Funds” for understanding the concept:
Rupee Cost Averaging — The Buying Benefit
In Mutual Funds, we get “units” in return for the amount we put into the fund. The price of each unit is called as “NAV” and is determined at the end of the trading day (unlike Listed Stocks/ETFs, where price changes continuously during the trading hours)
All the units have the same NAV at any given day.
Number of Units you buy is: Purchase Price / NAV
Your corpus value on any give day is: Total Units you own * NAV for that day.
Using this logic, below is the table depicting month by month purchase of units, and total value at the given day:
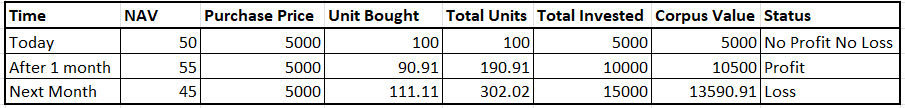
So, what just happened here?
- You bought less units than previous month for the same amount, when NAV rose.
- You bought more units than previous month for for the same amount, when NAV declined.
- After the above 3 payments, you own a total of 302.02 units. You invested ₹15000, so your average purchase price for each unit = 15000/302.01 = ₹49.67. Not ₹50, Not ₹55 and Not ₹45.
Over time, your buying cost averages out, because the market will be down on some months and up on other months. This concept is called Rupee Cost Averaging.
Important message to note here is the phrase “Over time”. Your buying cost averages out only over LONG periods of time ( > 5 years)
Also note, that the corpus value ( loss or profit) is the unrealized amount (or paper profit or loss), which means you don't really consume this loss or profit until you sell your units.
Does that mean, that instead of buying every month, you buy only when the market is down — so that you can buy more units.
Sure, you can, but, the truth is — Nobody knows where the market will be tomorrow — and this in itself can be a separate article to write on. But for now, lets establish this, that for a retail investor, whose primary job is NOT about studying the markets — Its quite difficult to time the market and predict correction periods.
Hence, SIP becomes a powerful tool for a retail investor to be invested in the market during ups and downs.
A SIP is not about timing the market. It’s about time IN the market.
Compounding — The Growth Benefit
Compounding is unidirectional. i.e. money keeps on growing.
Like in FDs — you deposit an amount, which is your principal, say ₹100.You earn interest 7% on that amount (₹7). At the end of the year, your total corpus is 100+7 = ₹107. Now, if you renew your FD, your principal is ₹107. You earn 7% on ₹107 (₹7.49) and not just on ₹100. At the end of the year, your total corpus is 107 + 7.49 = ₹114.49 (See, how you earned extra 0.49 on the ₹7 interest) and this goes on, until you close your FD.
That is your money getting compounded every year — It keeps on increasing.
In the SIP example above, we saw that the money didn't keep on growing every month. Then why do we say that money compounds in SIPs. Well, money doesn't compounds in literal sense. But you do see your money becoming ₹1 crore at 12% CAGR over 20 years, while you just invested ₹24lakhs in total. So, where did the gain of ₹72 lakhs come from?
To understand this, we need to go a level deeper.
When you are buying units of MFs, what is the MF actually buying?
- It generally buys the shares of different companies. (since, we assumed 12% returns in our example, which is a reasonable assumption for Equity MFs, for explanation purposes — we will exclude Hybrid Funds — that invest in Equity + Fixed Income products like Bond)
- The NAV of the fund is determined based on the prices of the shares of the companies they have bought.
- So, the NAV is dependent on the performance of the companies in the fund’s kitty.
- The NAV increases when there is an increase the share price of some of these companies.
- The NAV decreases when the share price of these companies falls.
Why the individual company’s share price rise of fall is dependent on many factors:
- The performance of the company (revenue, profits, debt, etc.)
- The reliability/relevance of the company (change in management structure, competition)
- Factors unrelated to the company altogether like the geo-political uncertainties — which in turn may reduce the investors confidence in the market
It is perceived that over long periods of time, for a growing economy with increased production for global demand and increased domestic consumption — the market tends to move upwards, i.e.
- consumption increase: employment rate increases — this increases domestic consumption — which in turn improves the performance(revenue) of the companies catering to that consumption.
- production increase: due to export increases — which benefits the export sector revenues.
So, the gain that you see is not the money compounding but time compounding — it happens due to the GROWTH in the country, over time…
Due to the growth, the NAV will rise over the years.
And as we have already seen,
your corpus value at any given day is Total Units you own * NAV for that day.
Over time, say 20 years, you keep on accumulating units (at different prices). The price of units you bought in earlier years (when you just started) will be much less as compared to what you bought in the recent years. The units bought in the earlier years, at lower prices will lead to substantial profits, because after 20 years, all the units will be of same price (NAV on that day).
And this is where, most SIP explanations get oversimplified. The cumulative growth in price — is what gets told as “compounding” in a SIP context.
The practical learning is: the earlier you start, the more time your money has to grow.
That Compounding Chart
Here’s a more realistic picture of how equity mutual fund returns actually behave and not 12% every year:
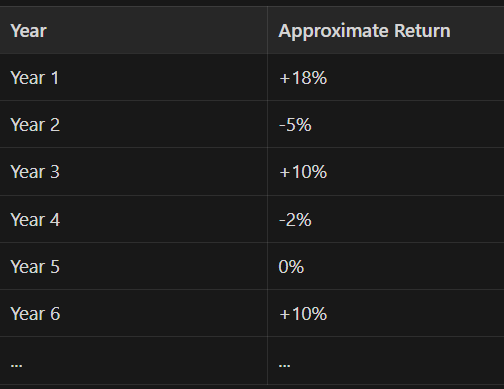
Negative years. Positive years. Flat years. All mixed in.
The 12% figure in your calculator is a long-term historical average — what the fund might deliver over a market cycle. The journey to get there is not a straight line.
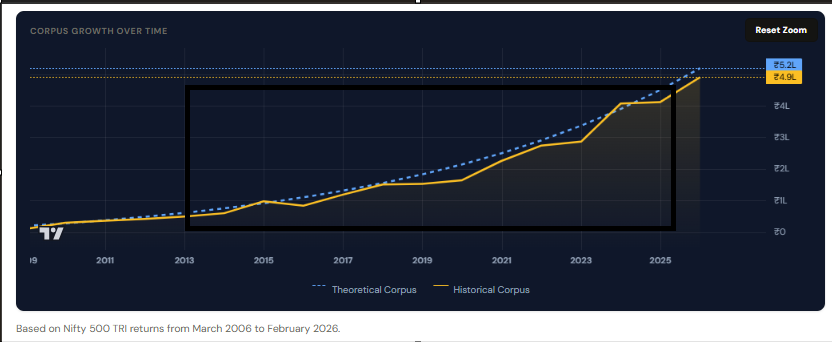
The highlighted rectangular box in black in the below image shows 2 lines:
- a straight dashed blue line — that represents the compounded growth — you see, always increasing
- the zig zag solid yellow line — that represents the actual path you money would have taken, if you would have invested 20 years ago.
Compounding in SIP illustrations is a simplification. Reality is messier — and that’s perfectly okay, as long as you understand what you are signing up for.
So Should You Be Worried?
No. Because,
When the market falls and your portfolio shows red, your SIP investment that month is buying units at a discount. More units for the same money. When the market recovers — and historically, over long periods, it has — those extra units you accumulated during the dip grow with it.
The down years in a SIP are not your enemy. They are the ones, who actually bump up your gain.
SIP = Consistency over time = Results.
Realistic Expectation
₹5,000 per month invested over 15 years.
A calculator at 12% p.a. shows approximately ₹25 lakh.
In reality, depending on the sequence of market returns during your investment period:
- A bad sequence of returns might deliver around ₹21 lakh
- A good sequence of returns might deliver around ₹29 lakh
Both are possible and neither of these is guaranteed.
So, practically, SIP means: investing a fixed amount (say ₹5,000) every month into an investment product of your choice — a mutual fund, an ETF, or similar. Automated deductions, every month, regardless of what the market is doing.
And what do we need to make this work?
- Patience — to continue even when your corpus is going down
- Discipline — to invest as per the schedule (every month), no matter what
- A Plan — so you know exactly what you’re working towards
Many people loose patience and the discipline to invest, because they do not have a plan. And they do not have a plan, because they do not know either all or one of the below:
- They do not know “what” is that ‘deferred consumption’ for which they are putting money in the market every month? — The Goal
- If at all they know the goal, they may not know “when” will they be actually consuming the money? — The time remaining for the Goal.
- And if they know both the above, they do not know “how much money” do they actually need for their goal? — The target/goal amount.
Three Questions to Ask YOURSELF Before You Start
1. What is this money for?
It is important that you know the purpose of the money and when will you need it. Without knowing about the withdrawal plan, you may end up loosing money rather than making the profits.
Lets try to understand the same with the charts below.
- Suitability:
The charts represents the growth of ₹5000/year investment over a period of 20 years (from 2006 to 2026). The corpus value after 20 years is around ₹5 lakh.

Focus on the solid yellow line, observe that the money grew significantly more after the year 2017 and stayed the same, with little increase in the initial years. This tells that SIP investments are primarily suited for long term goals. If you need it within 2–3 years, equity SIP is not the right vehicle. The market could be in a downturn exactly when you need to exit.
- Importance of planned withdrawal:
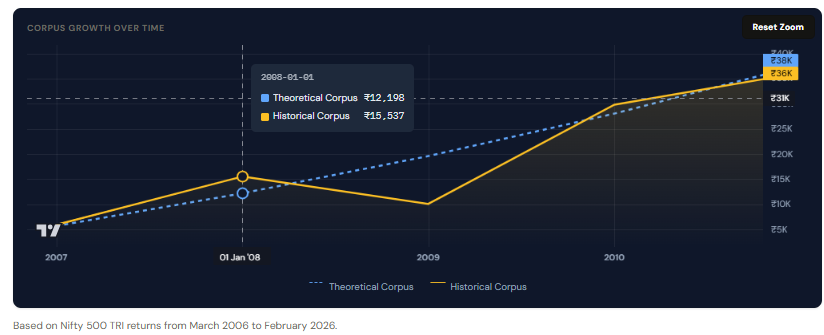
See the values of historical and theoretical corpus.
Theoretical corpus: The value based on the CAGR of 14% (straight dashed blue line) — what we understand theoretically for simplicity.
Historical corpus: The actual corpus value based on the NIFTY 500 TRI prices during that period.
You can see that historical corpus is more than theoretical corpus. why? Because the markets performed well in 2007 (just before the crash)
Now lets see the next year, in September 2008 — markets crashed.
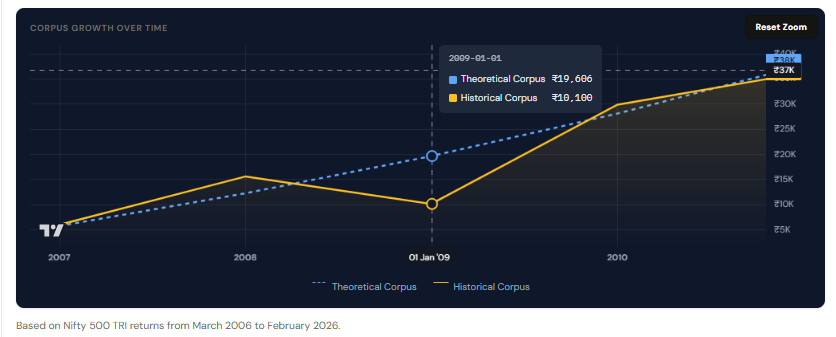
Historical corpus went down significantly low as compared to the theoretical corpus.
If someone doesn't has a withdrawal plan, they may panic and sell their investments at this time, thereby reducing profits.
Lets see what happens, if someone invested with a plan of 10 years.
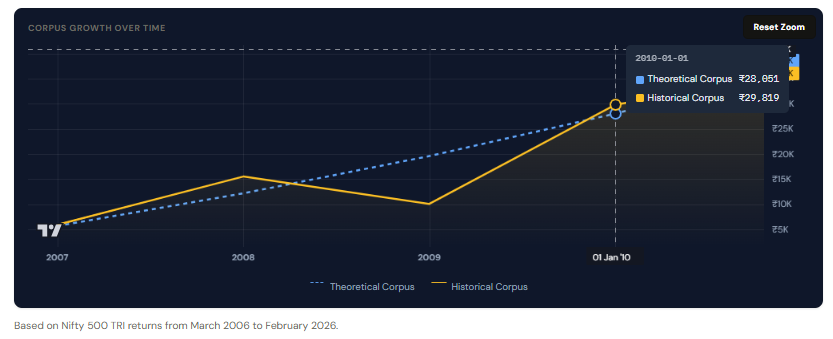
The markets recovered in 2010, and so did the investments. The historical corpus is more than the theoretical corpus.
For someone, who had a plan and didn't withdraw — didn't really get affected much due to the crash.
That's the power of planning and the meaning of “Plan” word in Systematic Investment Plan.
Note: the intent here refers to the discipline required in the market and doesn't talk about the fund being bad or good. Whether a particular fund is performing or not and the call to exit your SIP in that case, is a separate issue. It does not define the overall market trend.
Below is an image of historical simulation of 20 years SIP of 5000/year using the NIFTY 500 TRI values.
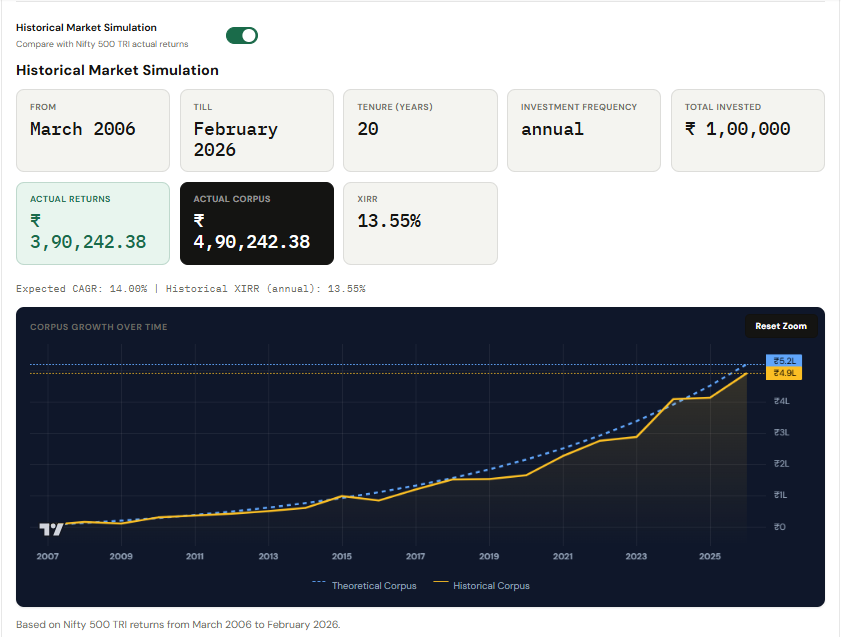
This helps you to understand how SIP investments grow in reality.
2. Can you stay invested when you see red, whether or not you have a plan?
This is the real test. Most people stop their SIPs when markets fall — taking losses and missing the recovery that follows the crash. Figure out how much loss you can tolerate? If you think that you may panic and sell because of a temporary paper losses of 15% or more, then you need to consider the same in your financial planning.
3. Are you diversified?
The investments should be adjusted to your risk appetite and timeline to give you better balance across different market cycles, instead of concentrating all your SIP contributions into one fund or one category.
The Bottom Line
SIP is one of the most powerful tools available to a retail investor. The compounding is real. The goal accomplishment over time is real — provided you do the math right and make appropriate assumptions.
But the journey is not a smooth 12% every year. It’s bumpy, occasionally difficult and almost always rewarding for those who stay the course.
The compounding chart you see is the destination. The actual ride is full of ups and downs. Both are true. And knowing this makes you a better investor.
Run the numbers
I realized that articles are not sufficient to help people understand personal finance and so I have been working on my website to provide you with the tools that you can actually use to deepen your understanding of the concepts that you read through my articles.
I am starting with the first calculator on my site — SIP Calculator.
Each calculator on thefinancialhygiene.com will be aimed to give you an insight that is often overlooked by the regular calculators available online for that topic.
Try the SIP Calculator at thefinancialhygiene.com
Most calculators give you one smooth line at one assumed rate of return.
The SIP calculator at thefinancialhygiene.com is designed to show you a better picture by simulating your exact investments ( frequency, amount and tenure ) on historical NIFTY 500 TRI prices to give you the sense of how the path may actually be and what XIRR your investments make.
You can zoom in the chart, navigate year by year historical return, compare the theoretical and historical values of the corpus on any particular year.
Note: One should not depend on historical returns to predict the future returns, but the historical data acts as a reference in terms of how realistic your expectations are — consider it as a benchmark only. The actual may vary from what is shown in the calculations.
If this was useful, share it with someone who thinks SIP = guaranteed 12% every year.
The more people invest with realistic expectations, the longer they stay invested — and that’s what actually creates wealth.
Because understanding what you are building is the first step to building it well.
This article is for educational purposes only and not financial advice.
Mutual fund investments are subject to market risks. Please read all scheme-related documents carefully.
SIP — In Reality was originally published in DataDrivenInvestor on Medium, where people are continuing the conversation by highlighting and responding to this story.

