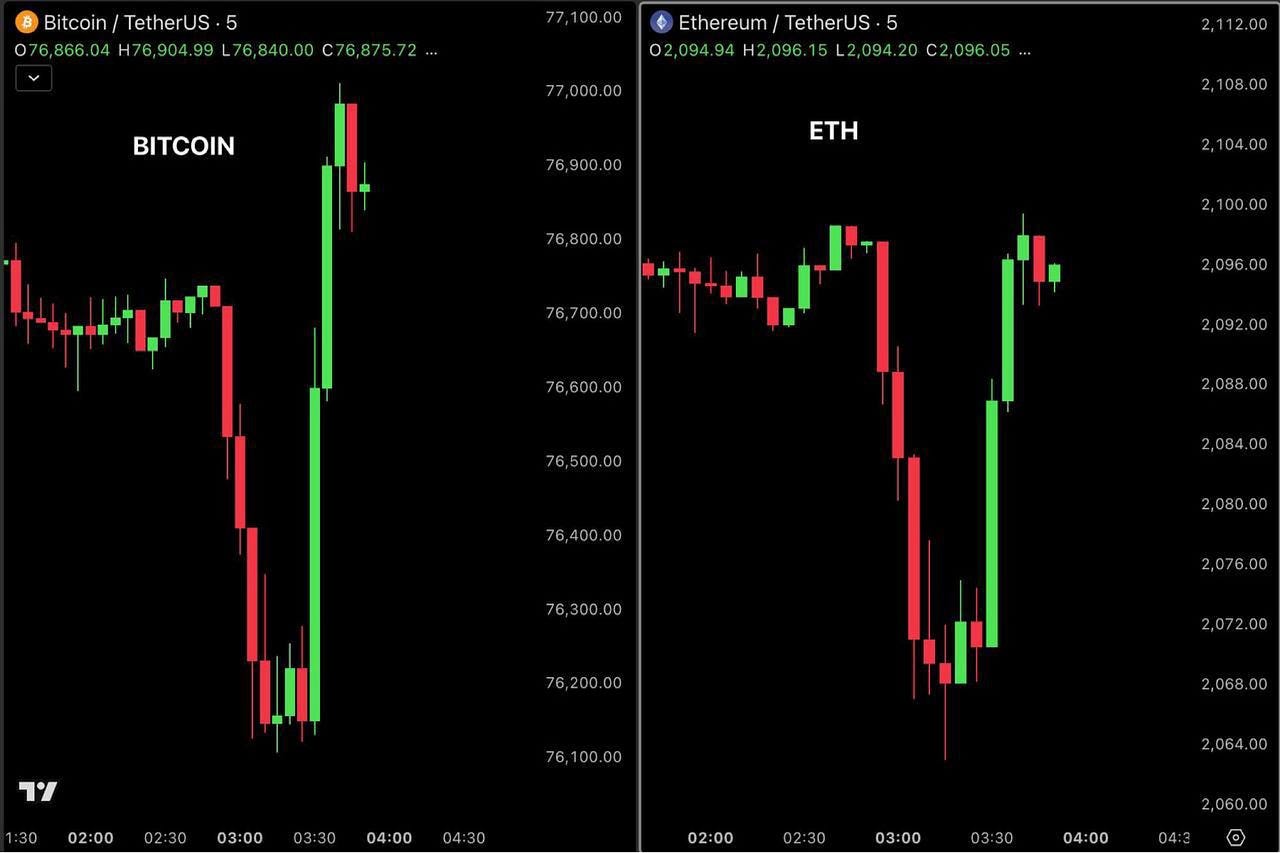
There’s a split in markets right now that’s worth paying attention to. The S&P 500 is sitting within touching distance of its record high, while Bitcoin is stuck roughly 39% below the peak it set last October. Both assets just got handed the same piece of good news this week, and only one of them did much with it. On Wednesday, Trump said the US-Iran talks had reached their “final stages”, and that was enough to knock oil sharply lower. West Texas Intermediate (WTI) crude shed more than 5% to settle around $98 a barrel. Lower energy prices take some of the heat out of the inflation picture, and equity traders run with it. The S&P 500 closed up 1.1% near 7,433, the Dow added 1.3% to reclaim 50,000, and the Nasdaq gained 1.5%. Bitcoin barely moved. At the time of writing, it’s changing hands around $77K, more or less where it sat before the headline crossed. Same tailwind, two very different reactions. So what’s actually going on? The two markets aren’t responding to the same thing Part of the answer is that equities are trading on the immediate catalyst, oil down, inflation fears easing, and a fresh wave of enthusiasm around AI after SpaceX filed its IPO prospectus and reports surfaced that OpenAI is preparing to follow. There’s also a deep, structural bid under stocks, the buybacks and passive inflows that keep buying more or less regardless of the headline. That kind of demand doesn’t switch off overnight. Bitcoin doesn’t have any of that working for it. It runs on liquidity and risk appetite at the margin, and right now, the margin is exactly where the pressure is showing. The 30-year Treasury yield touched 5.2% earlier this week, its highest since 2007. The dollar is holding firm near 99. And after months of pricing in rate cuts, traders have flipped. CME FedWatch now puts the odds of a December hike at around 51%, with barely a 10% chance of any cut this year. The liquidity backdrop hasn’t loosened at all. Equities can look past that for now, but Bitcoin can’t. The S&P chart looks healthy S&P 500 daily. Price bounced from the 0.382 Fibonacci retracement around 7,360 and is working back toward the 7,500 swing high, holding above its rising moving averages with the broader uptrend intact. On the daily timeframe, the S&P 500 printed a strong bullish candle on Wednesday that closed near its highs, which points to buyers stepping back in after the pullback from the recent record. The bounce came off the 0.382 Fib around 7,360, a shallow retracement that keeps the broader uptrend intact, and it sets up what could become a higher swing low if it holds. Price is now grinding back toward 7,500, the recent high and the resistance just overhead. S&P 500 4-hour. Price has reclaimed both the 20 and 50 EMA and broken structure to the upside, with the Accumulation/Distribution line pushing to new highs beneath price. Drop down to the 4-hour and the shorter-term picture has turned back in the bulls’ favour. Price has reclaimed both the 20 and 50 Exponential Moving Average (EMA), and a low-timeframe break of structure suggests momentum is building again. The Relative Strength Index (RSI) is back above 50, and the Accumulation/Distribution line is making new highs, which tends to show buying pressure quietly building under the surface. If that continues, 7,500 comes back into play. For reference, the levels to be watched on the S&P are 7,500 as the overhead resistance, with support layered beneath at 7,360 (the 0.382 Fib and Wednesday’s bounce), 7,320 (the 0.5), 7,280 (the 0.618, reinforced by the rising 4-hour 50 EMA), and the larger demand zone around 7,105 to 7,160 below that. It’s the look of a trend in good shape, a shallow dip that got bought quickly, with no real overhead supply to fight through. The flows tell the opposite story for Bitcoin Bitcoin’s marginal buyer right now is the spot Bitcoin Exchange-Traded Fund (ETF) complex, and that buyer has turned seller. Spot Bitcoin ETFs saw their largest single-day outflow since January, with roughly $649 million leaving in one session, and across the week, digital-asset products shed around $1.07 billion, the first negative week in seven. When the main source of fresh demand starts redeeming, price tends to lag, no matter how good the macro headline looks. So the divergence isn’t really a mystery; you can see it directly in where the money is going. On-chain says recovery, but not yet confirmed The on-chain data tells much the same story. Glassnode’s latest weekly note shows spot demand cooling, with the 30-day average of its Realized Profit/Loss Ratio sitting around 1.8. That’s a long way off the February lows, but it’s still under the 2.0 mark that has tended to signal genuine buy-side conviction in the past. Buyers are back, in other words, just not with much force. Funding rates add a wrinkle. They’ve now been negative for 82 days straight, the longest such streak in Bitcoin’s history, which means traders are paying to hold shorts rather than longs. That isn’t the
PrimeXBT: Bitcoin is lagging as S&P 500 nears records, here’s what the divergence is telling us
This article was originally published on AMBCrypto and is republished here under RSS syndication for informational purposes. All rights and intellectual property remain with the original author. If you are the author and wish to have this article removed, please contact us at [email protected].