I stared at the number for a solid minute. 97 percent.
Ninety-seven percent of customers on the Brazilian marketplace OLIST made exactly one purchase and never came back. This was not just poor retention. This was a retention crisis hiding in plain sight inside 99,441 orders.
But I am getting ahead of myself. Let me take you back to where this project started, and more importantly, how I built the data infrastructure that made this discovery possible.
Why OLIST? Why This Dataset?
OLIST is a Brazilian B2B2C marketplace aggregator that connects over 3,000 small merchants to major e-commerce platforms like Mercado Livre. They handle the complicated parts: logistics, payments, customer service. Merchants just list products and fulfill orders.
The publicly available dataset spans September 2016 to October 2018 and contains 99,441 orders across 9 interconnected CSV files. Order details, customer information, product catalog, seller data, payments, reviews, and geolocation coordinates. Everything you need to understand how a marketplace actually operates.
More importantly, this dataset is messy. Really messy. Duplicate records, inconsistent types, missing values, referential integrity issues. All the problems you encounter in real production data. Which made it perfect for building a proper data warehouse from scratch.
I wanted to answer business questions like: Who are our customers? What drives repeat purchases? Which products perform best? How does delivery speed affect satisfaction? But first, I needed a foundation that would not fall apart the moment I asked complex questions.
That foundation needed to be a medallion data warehouse.
The Medallion Architecture Decision
Before writing a single line of SQL, I made a critical architectural choice. Instead of dumping everything into one messy database and hoping for the best, I would build three distinct layers.
Bronze Layer: Raw Truth
Land data exactly as it arrives from the source. No transformations, no cleaning, no opinions. Just CSV files loaded into tables with VARCHAR columns and audit timestamps. If the source says a date is stored as text, Bronze keeps it as text. If there are duplicates, Bronze keeps the duplicates. This layer is your source of truth, your always-available rollback point when transformations go wrong.
Silver Layer: Quality and Standards
Cast data types correctly. Clean strings. Deduplicate records. Validate referential integrity. Handle nulls gracefully. This is where data becomes usable but stays close to its original structure. One row in Bronze should map to one row in Silver, just cleaned and validated.
Gold Layer: Business Schema
Transform data into the shape your business questions need. Build star schemas. Pre-aggregate metrics. Create calculated fields. This layer optimizes for analytics, not for mirroring the source.
Why go through all this trouble instead of just cleaning the CSVs and loading them once?
Because I knew data quality issues would emerge. And when they did, I needed the ability to trace problems backward through each transformation layer. Bronze preserved the original data. Silver documented every cleaning decision. Gold focused purely on business value.
This separation of concerns would save me days of debugging. I just did not know it yet.
Bronze Layer: Landing Raw Reality
The Bronze layer started simple. Create a database, define tables with flexible VARCHAR columns, and bulk load CSV files.
Here is what one table looked like:
CREATE TABLE IF NOT EXISTS orders (
    order_id                        VARCHAR(50),
    customer_id                     VARCHAR(50),
    order_status                    VARCHAR(30),
    order_purchase_timestamp        VARCHAR(30),
    order_approved_at               VARCHAR(30),
    order_delivered_carrier_date    VARCHAR(30),
    order_delivered_customer_date   VARCHAR(30),
    order_estimated_delivery_date   VARCHAR(30),
    _loaded_at                      TIMESTAMP DEFAULT CURRENT_TIMESTAMP
);
Everything is VARCHAR. Even timestamps. Even numeric fields. This might seem wrong, but it is intentional. Bronze does not make assumptions about data quality. If a CSV contains malformed dates or unexpected characters, VARCHAR will accept them. We fix types in Silver.
I loaded 9 tables this way:
- customers (99,441 rows)
- orders (99,441 rows)
- order_items (112,650 rows)
- order_payments (103,886 rows)
- order_reviews (99,224 rows)
- products (32,951 rows)
- sellers (3,095 rows)
- geolocation (1,000,163 rows)
- product_category_translation (71 rows)

The first validation query confirmed all files loaded. But I already knew problems were lurking. The geolocation table had over 1 million rows for only 19,000 unique zip codes. The order_reviews table had duplicate review IDs. Product dimension columns contained empty strings that would break numeric casts.
Bronze is supposed to be messy. That is the point. Document the mess, then fix it systematically in Silver.
Silver Layer: Where the Real Work Begins
Silver is where data engineering becomes problem solving. Every transformation decision needs a reason. Every type cast needs null handling. Every deduplication strategy needs business logic.
Here is how I transformed the orders table:
CREATE TABLE orders AS
SELECT
    order_id,
    customer_id,
    TRIM(UPPER(order_status)) AS order_status,
    STR_TO_DATE(NULLIF(order_purchase_timestamp, ''), '%Y-%m-%d %H:%i:%s') AS order_purchase_timestamp,
    STR_TO_DATE(NULLIF(order_approved_at, ''), '%Y-%m-%d %H:%i:%s') AS order_approved_at,
    STR_TO_DATE(NULLIF(order_delivered_carrier_date, ''), '%Y-%m-%d %H:%i:%s') AS order_delivered_carrier_date,
    STR_TO_DATE(NULLIF(order_delivered_customer_date, ''), '%Y-%m-%d %H:%i:%s') AS order_delivered_customer_date,
    STR_TO_DATE(NULLIF(order_estimated_delivery_date, ''), '%Y-%m-%d %H:%i:%s') AS order_estimated_delivery_date,
    CURRENT_TIMESTAMP AS _processed_at
FROM olist_bronze.orders
WHERE order_id IS NOT NULL
AND customer_id IS NOT NULL;
Notice the defensive SQL patterns. NULLIF(field, '') converts empty strings to proper NULL values before type casting. STR_TO_DATE with explicit format strings handles date parsing consistently. TRIM(UPPER()) standardizes text fields. WHERE clauses filter out rows with missing critical keys.
This worked fine for simple tables. But three tables had serious data quality issues that required deeper investigation.
Battle 1: The Review Deduplication Nightmare
I expected order_reviews to have 99,224 unique rows. One review per review_id. Simple.
Then I ran this query:
SELECT
    review_id,
    COUNT(*) AS review_count,
    GROUP_CONCAT(order_id) AS order_ids,
    GROUP_CONCAT(review_score) AS review_scores
FROM olist_bronze.order_reviews
GROUP BY review_id
HAVING COUNT(*) > 1
ORDER BY review_count DESC;
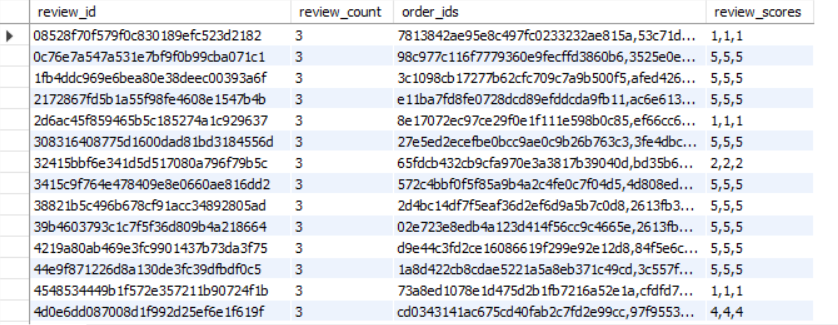
789 review IDs appeared multiple times. Same review_id mapped to different order_ids with identical timestamps, identical scores, identical comment text. This is physically impossible. A customer cannot write multiple reviews at the exact same millisecond.
This was a data integrity issue in the source dataset itself.
I had two options. Keep the first occurrence based on timestamp, or keep all and handle duplicates downstream. I chose the first approach because business logic says one review equals one customer opinion, regardless of how many times it appears in the data file.
Here is the deduplication logic:
CREATE TABLE order_reviews AS
SELECT
    review_id,
    order_id,
    review_score,
    review_comment_title,
    review_comment_message,
    review_creation_date,
    review_answer_timestamp
FROM (
    SELECT
        review_id,
        order_id,
        CAST(review_score AS UNSIGNED) AS review_score,
        TRIM(review_comment_title) AS review_comment_title,
        TRIM(review_comment_message) AS review_comment_message,
        STR_TO_DATE(NULLIF(review_creation_date, ''), '%Y-%m-%d %H:%i:%s') AS review_creation_date,
        STR_TO_DATE(NULLIF(review_answer_timestamp, ''), '%Y-%m-%d %H:%i:%s') AS review_answer_timestamp,
        ROW_NUMBER() OVER (PARTITION BY review_id ORDER BY review_creation_date) AS rn,
        CURRENT_TIMESTAMP AS _processed_at
    FROM olist_bronze.order_reviews
    WHERE review_id IS NOT NULL
) ranked
WHERE rn = 1;
ROW_NUMBER() partitioned by review_id, ordered by timestamp. Keep row number 1, discard the rest. Final count: 98,400 unique reviews. 814 duplicate rows eliminated.
Problem solved. On to the next one.
Battle 2: The Geolocation Aggregation Challenge
The geolocation table was supposed to map zip codes to latitude and longitude coordinates for geographic analysis. One row per zip code, right?
Wrong. 1,000,163 rows for 19,015 unique zip codes.
Here’s how the top 10 zip code with most occurences looked like:
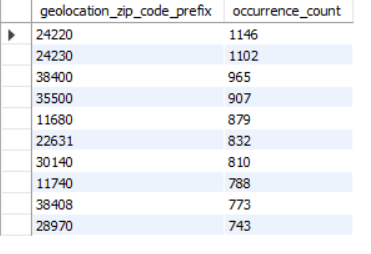
Each zip code appeared dozens of times, inflating the count. For analytics, I needed one representative coordinate per zip code.
The solution: Mode-based aggregation. For each zip code, find the lat/lng combination that appears most frequently, and keep that.
CREATE TABLE geolocation AS
WITH geo_counts AS (
    SELECT
        CAST(geolocation_zip_code_prefix AS UNSIGNED) AS zip_prefix,
        geolocation_lat,
        geolocation_lng,
        TRIM(geolocation_city) AS city,
        TRIM(geolocation_state) AS state,
        COUNT(*) AS occurrence_count
    FROM olist_bronze.geolocation
    WHERE geolocation_zip_code_prefix IS NOT NULL
    GROUP BY
        CAST(geolocation_zip_code_prefix AS UNSIGNED),
        geolocation_lat,
        geolocation_lng,
        TRIM(geolocation_city),
        TRIM(geolocation_state)
),
geo_ranked AS (
    SELECT
        zip_prefix,
        geolocation_lat,
        geolocation_lng,
        city,
        state,
        ROW_NUMBER() OVER (
            PARTITION BY zip_prefix
            ORDER BY occurrence_count DESC
        ) AS rn
    FROM geo_counts
)
SELECT
    zip_prefix AS geolocation_zip_code_prefix,
    geolocation_lat,
    geolocation_lng,
    city AS geolocation_city,
    state AS geolocation_state,
    CURRENT_TIMESTAMP AS _processed_at
FROM geo_ranked
WHERE rn = 1;
First CTE counts how often each unique lat/lng combination appears for a given zip. Second CTE ranks by occurrence count. Final SELECT keeps rank 1.
Result: 19,015 unique zip codes, down from 1,000,163 rows. Geographic analysis now possible without coordinate noise.
Battle 3 : The Cartesian Product That Almost Broke Everything
The Gold layer fact table would be the heart of the analytics platform. One row per order with aggregated metrics from items, payments, and reviews.
My first attempt looked reasonable:
-- WRONG APPROACH (resulted in 800K+ rows from 99K orders)
CREATE TABLE fact_orders AS
SELECT
    o.order_id,
    o.customer_id,
    SUM(oi.price) AS order_revenue,
    SUM(op.payment_value) AS total_payment,
    AVG(r.review_score) AS avg_review
FROM orders o
LEFT JOIN order_items oi ON o.order_id = oi.order_id
LEFT JOIN order_payments op ON o.order_id = op.order_id
LEFT JOIN order_reviews r ON o.order_id = r.order_id
GROUP BY o.order_id, o.customer_id;
This query returned 800,000+ rows instead of 99,441.
Let me explain with an example.


Aggregating on this inflated row set multiplies values incorrectly. In this example, the order has 3 items and 1 payment. The item prices sum correctly because each item appears once. But the payment value (R$109.29) gets duplicated 3 times — once per item — and summing gives R$327.87 instead of R$109.29.
One order can have 3 items and 1 payment. Joining them directly creates 3 rows where the same payment appears 3 times. Sum the payment column and you get triple the actual amount. If the order had multiple items AND multiple payments (say 3 items × 2 payments = 6 rows), both metrics would inflate.
Cartesian product. The classic many-to-many join trap.
This “row explosion” is formally known as a Fan-out. When joining tables with a one-to-many relationship (like 1 order to many payments) without pre-aggregation, SQL creates a row for every combination. In a production environment, this doesn’t just give wrong numbers; it causes massive memory overhead and query latency.
The fix: Pre-aggregate each child table BEFORE joining to the parent.
CREATE TABLE fact_orders AS
WITH order_aggregates AS (
    SELECT
        order_id,
        SUM(price) AS total_price,
        SUM(freight_value) AS total_freight,
        COUNT(order_item_id) AS item_count
    FROM olist_silver.order_items
    GROUP BY order_id
),
payment_aggregates AS (
    SELECT
        order_id,
        SUM(payment_value) AS total_payment,
        MAX(payment_installments) AS max_installments
    FROM olist_silver.order_payments
    GROUP BY order_id
),
review_aggregates AS (
    SELECT
        order_id,
        AVG(review_score) AS avg_review_score
    FROM olist_silver.order_reviews
    GROUP BY order_id
)
SELECT
    o.order_id,
    o.customer_id,
    c.customer_unique_id,
    o.order_status,
    o.order_purchase_timestamp,
    COALESCE(oa.total_price, 0) AS order_revenue,
    COALESCE(pa.total_payment, 0) AS payment_value,
    ra.avg_review_score AS review_score,
    DATEDIFF(o.order_delivered_customer_date, o.order_purchase_timestamp) AS delivery_time_days
FROM olist_silver.orders o
JOIN olist_silver.customers c ON o.customer_id = c.customer_id
LEFT JOIN order_aggregates oa ON o.order_id = oa.order_id
LEFT JOIN payment_aggregates pa ON o.order_id = pa.order_id
LEFT JOIN review_aggregates ra ON o.order_id = ra.order_id;
Three separate CTEs. Each one aggregates its table to order-level grain BEFORE any joins happen. Then the main query joins pre-aggregated results to orders. No cartesian product. No row explosion. No metric inflation.
Final validation: 99,441 rows. Exactly one per order. Metrics correct.
This pattern of pre-aggregating before joining became my defensive SQL standard for the rest of the project.
Gold Layer : The Star Schema Design
With clean data in Silver, I built a star schema optimized for business questions.
Fact Table: fact_orders
One row per order. Contains measures: order_revenue, payment_value, review_score, delivery_time_days, delivery_delay_days.
Dimension Tables:
- dim_customers: One row per customer_unique_id (96,096 customers)
- dim_products: One row per product_id (32,951 products)
- dim_sellers: One row per seller_id (3,095 sellers)
- dim_date: One row per calendar date (1,096 days from 2016–2018)
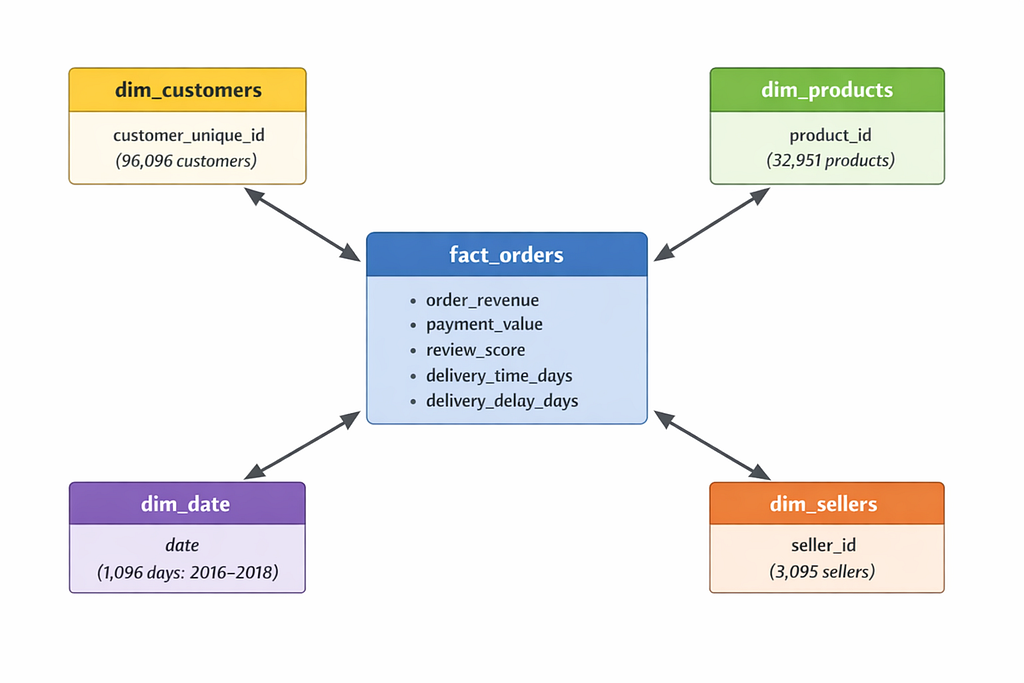
The design choice here was grain. I chose order-level grain instead of item-level because primary business questions focused on order behavior. How many orders per customer? What is average order value? How does delivery speed affect satisfaction?
Item-level analysis like which specific products sell together would require a separate fact_order_items table. I documented this as future work.
Each dimension got a primary key constraint for referential integrity and automatic indexing:
ALTER TABLE fact_orders ADD PRIMARY KEY (order_id);
ALTER TABLE dim_customers ADD PRIMARY KEY (customer_unique_id);
ALTER TABLE dim_products ADD PRIMARY KEY (product_id);
ALTER TABLE dim_sellers ADD PRIMARY KEY (seller_id);
ALTER TABLE dim_date ADD PRIMARY KEY (date_key);
Foreign key constraints were deliberately omitted. In OLAP data warehouses, foreign keys add write overhead without much benefit since referential integrity was already validated in Silver. Query performance matters more than write-time constraint checking.
The Customer Count Mystery
After Gold layer was built, I ran validation queries. One result made me pause.
Orders table: 99,441 rows
Customers dimension: 96,096 rows
Wait. If there are 99,441 orders but 96,096 customers, that means only few customers placed multiple orders. How many?
I dug into the customer table structure. It had two ID fields:
- customer_id: Changes with every order (transactional identifier)
- customer_unique_id: Stays the same across orders (person identifier)
So 99,441 customer_id values represented 96,096 actual people. The difference: 3,345 customers who made repeat purchases.
Quick math: 3,345 repeat customers out of 96,096 total equals 3.5 percent repeat rate.
Which means 96.5 percent are one-time buyers.

I re-ran the calculation multiple times to make sure. Checked for null values. Validated the join logic. Looked for data quality issues.
The number held.
96.5 percent one-time buyers.
Industry benchmarks for e-commerce typically show 20 to 30 percent repeat purchase rates. OLIST was at 3.5 percent. This was not just below average but a major retention crisis.
And I had not even started the customer segmentation analysis yet. That number would get worse.
Lessons Learned the Hard Way
Building this data warehouse taught me principles that no tutorial ever mentioned.
Medallion architecture is insurance
I referenced Bronze data at least a dozen times when Silver transformations produced unexpected results. Having the untouched source available meant I could always trace problems backward without re-downloading CSVs or questioning if my memory of the original data was correct.
Pre-aggregate before joining
The cartesian product mistake cost me an afternoon of debugging. Now my default pattern is: if joining tables with different grains, aggregate each to matching grain first. Never join raw many-to-many relationships.
Defensive SQL everywhere
NULLIF() for empty strings. COALESCE() for null handling. WHERE NOT NULL filters on critical keys. TRIM() on all text. CAST() with explicit types. Every transformation needs null and edge case handling, not just the obviously messy fields.
Validation queries are not optional
I wrote validation queries for every layer. Row counts. Uniqueness checks. Referential integrity. Null counts. Range checks. These queries caught problems early before they propagated downstream. Some people see validation as extra work. I see it as the difference between trusting your data and hoping your data is correct.
Document your data quality decisions
Why did I deduplicate reviews by keeping the first occurrence? Why did I use mode aggregation for geolocation? Why did I choose order-level grain for the fact table? I documented these decisions in a seperate file as well as SQL comments because six months from now I will forget my reasoning, and the next person working on this will need to know.
What Comes Next?
The data warehouse is built. Bronze, Silver, and Gold layers are operational. The star schema is validated. I have a fact table with 99,441 orders and clean dimension tables ready for analysis.
But I still need to answer the big question: Why is retention so catastrophically low?
In Part 2, I will dive into customer segmentation using RFM analysis, break down the 96,096 customers into behavioral groups, and design a statistical experiment to test if a retention intervention can actually move that 3.5 percent repeat rate.
Spoiler: The real repeat rate is even worse than 3.5 percent. And the A/B test results will be surprising.
Note: All code and queries used in this project are available on GitHub. The complete medallion architecture SQL scripts, validation queries, and detailed documentation can be found in the project repository.
This is Part 1 of a 3-part series on building an end-to-end analytics project for e-commerce marketplace data.
Part 1: Building a Medallion Data Warehouse to Solve a 97 Percent Retention Crisis was originally published in Level Up Coding on Medium, where people are continuing the conversation by highlighting and responding to this story.