and trying to explain venture capital through “coin flip” games.
Originally published at: https://offsquare.substack.com/p/on-power-laws

Does the venture capital funding schedule create the power law, or does the power law necessitate the venture capital funding schedule?
Every venture capitalist I have ever spoken with treats the power law as received wisdom. A small number of investments generate the vast majority of returns, while most return little or nothing. The numbers are stark: roughly 4% of venture investments produce the bulk of a fund’s gains, and about 65% return less than the invested capital. Y Combinator is a famous case. In Paul Graham’s 2012 essay Black Swan Farming, he noted that just two of YC’s investments — Airbnb and Dropbox — accounted for about three-quarters of the portfolio’s total value. Horsley Bridge, a major LP, found that just 5% of capital deployed between 1985 and 2014 generated half of all returns.
The entire industry is structured around this fact. Fund strategy, portfolio construction, deal terms, follow-on reserves — all of it assumes the power law as a given. But I have never heard a satisfying explanation for why venture returns follow a power law in the first place. Is the funding structure merely capitalizing on a naturally occurring distribution? Or is it actively producing the distribution it claims to exploit? To answer that, we need to look at the mathematics of power laws and then map those mathematics onto the mechanics of venture fundraising.
How Venture Fundraising Works
Venture capital fundraising is broken into stages designed to reduce risk for each investor and size investments appropriately. The standard schedule starts with a pre-seed round, then seed, then Series A, B, C, D, and so on, for however many rounds the company needs before it either gets acquired or goes public. In each round, the company issues new shares and gives equity to investors in return for capital. A typical round dilutes existing shareholders by around 20%.
Each successive stage assumes a certain level of maturity for the company, whether that is measured in employees, revenue, or product traction, as well as a certain amount of risk for the investor. The amount of capital invested typically increases with each round, and some percentage of companies that raised the previous round fail to survive long enough to raise the next one.
To ground this in recent data: median round sizes range from about $500K-$1M at pre-seed, to $2–4M at seed, $10–12M at Series A, ~$30M at Series B, ~$50M at Series C, and $100M or more at Series D and beyond. Post-money valuations follow a similar exponential curve: $5–6M at pre-seed, $12–15M at seed, $40–45M at Series A, $50–105M at Series B, $100–250M at Series C, and $500M or more at Series D. (1)
Meanwhile, the graduation rates tell the other half of the story. About 67% of pre-seed-funded startups raise a seed round, but only about 33% of seed-funded startups make it to Series A. That seed-to-A chokepoint is the narrowest bottleneck in the venture funnel. After Series A, the odds improve: roughly 65% of Series A companies raise a Series B, about 75% of Series B companies reach Series C, and 80% or more of Series C companies raise a Series D. The funnel is widest at the top and tightest at the seed-to-A transition, then gradually relaxes as the surviving companies prove themselves. (2)
It’s not immediately obvious from this description alone why venture outcomes should follow a power law. To see why, we need to understand what a power law actually is, mathematically, and what kinds of processes generate one.
Three Coin-Flip Games
To build some intuition for power laws, let’s compare three different games involving coin flips, which produce three fundamentally different probability distributions.
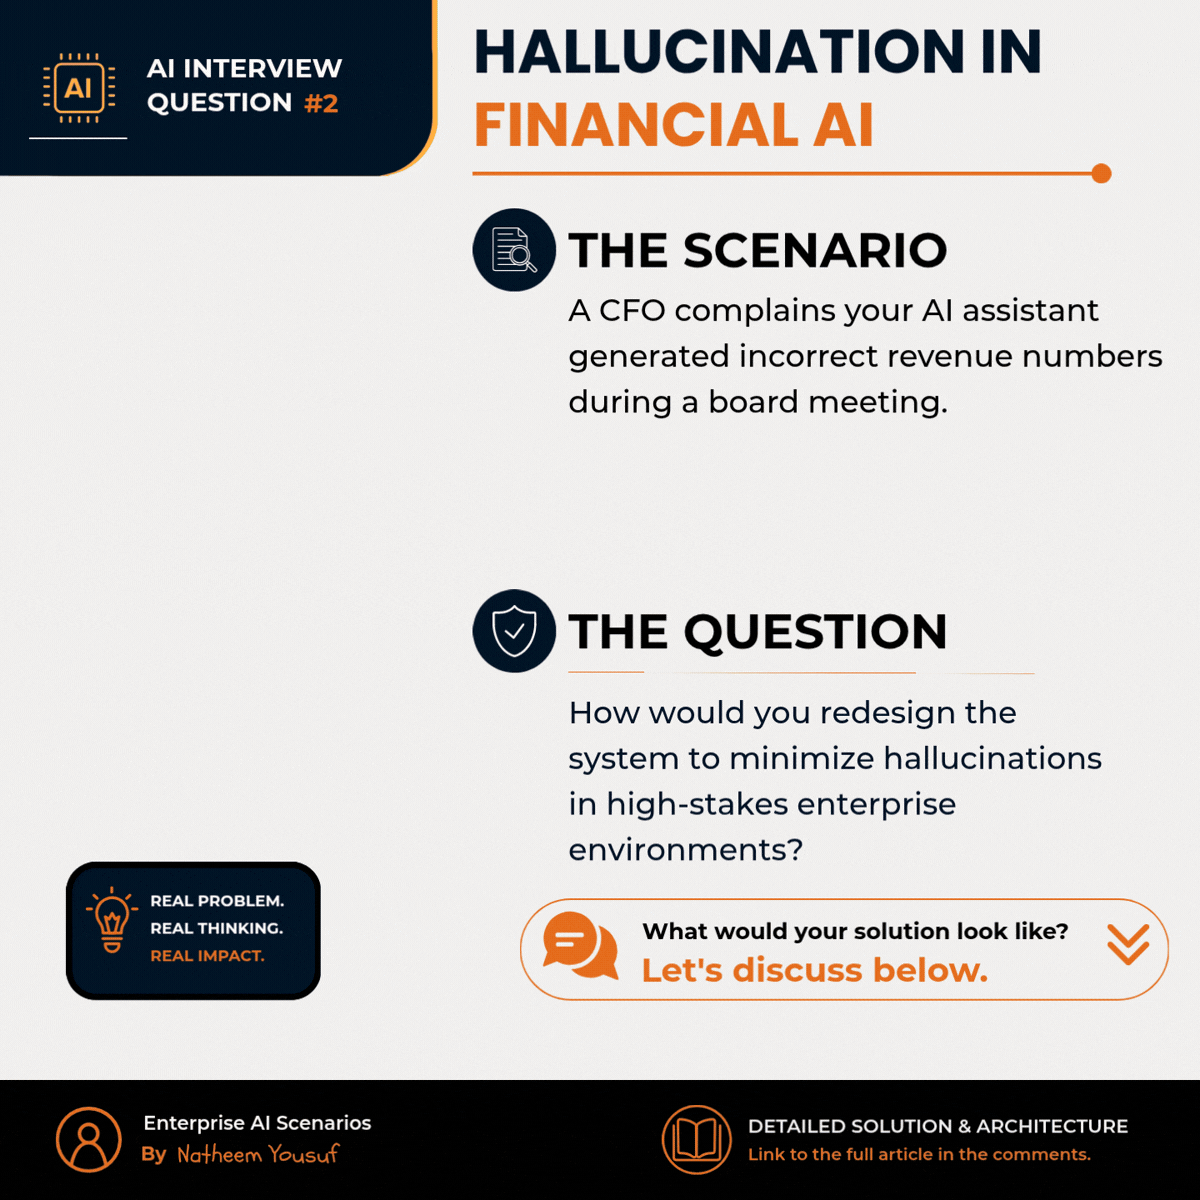
Game 1: Additive payoffs. You flip a fair coin 100 times. For every heads, you earn $1.
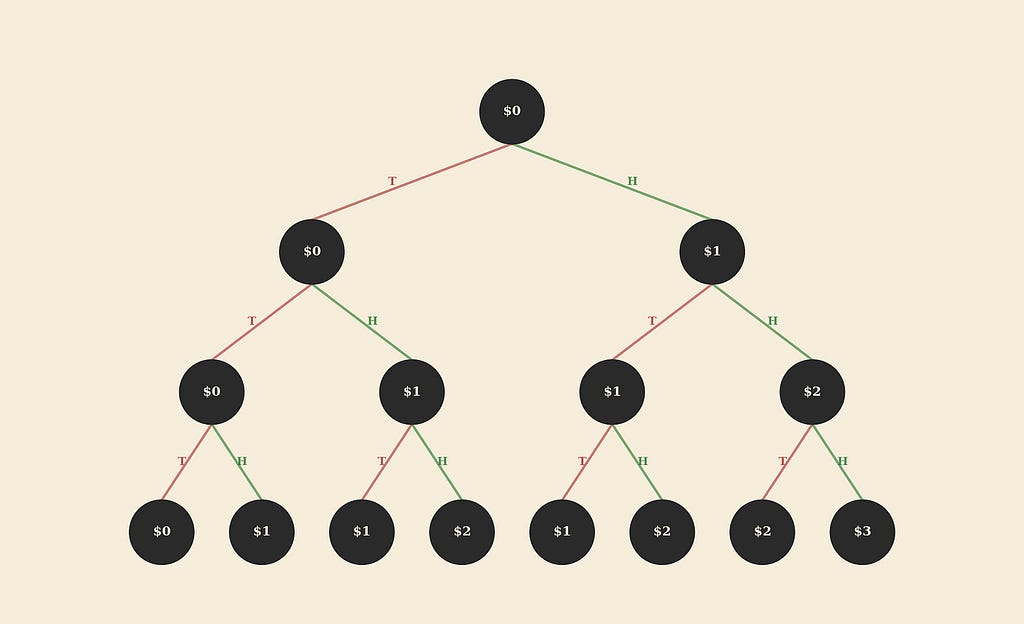
By the central limit theorem, your expected earnings are $50, and the distribution of outcomes across many players approximates a normal distribution centered around $50. The fair price to play this game is anything below $50.
This is the distribution most people intuitively expect. Outcomes cluster around the mean, and extreme results are rare.
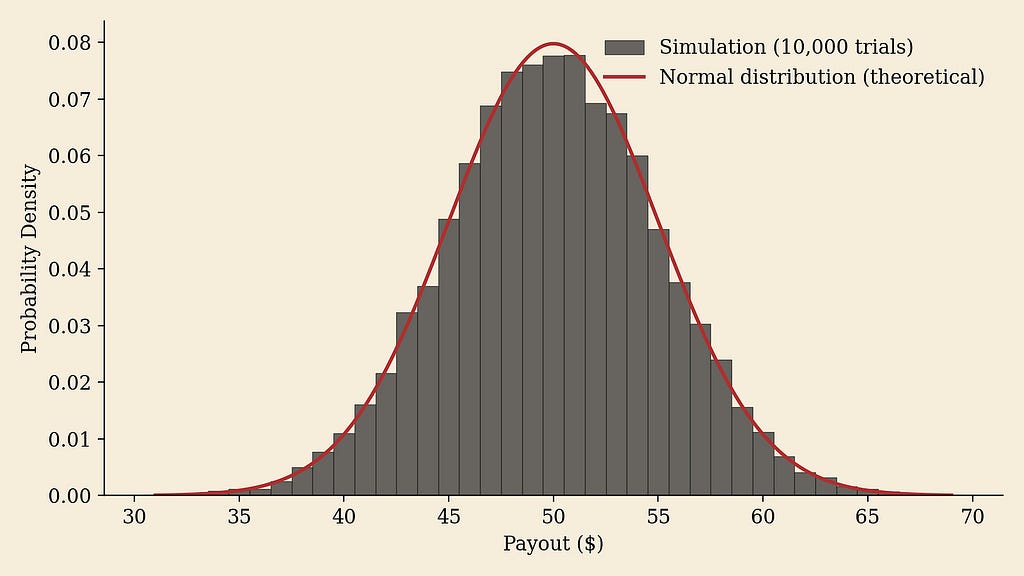
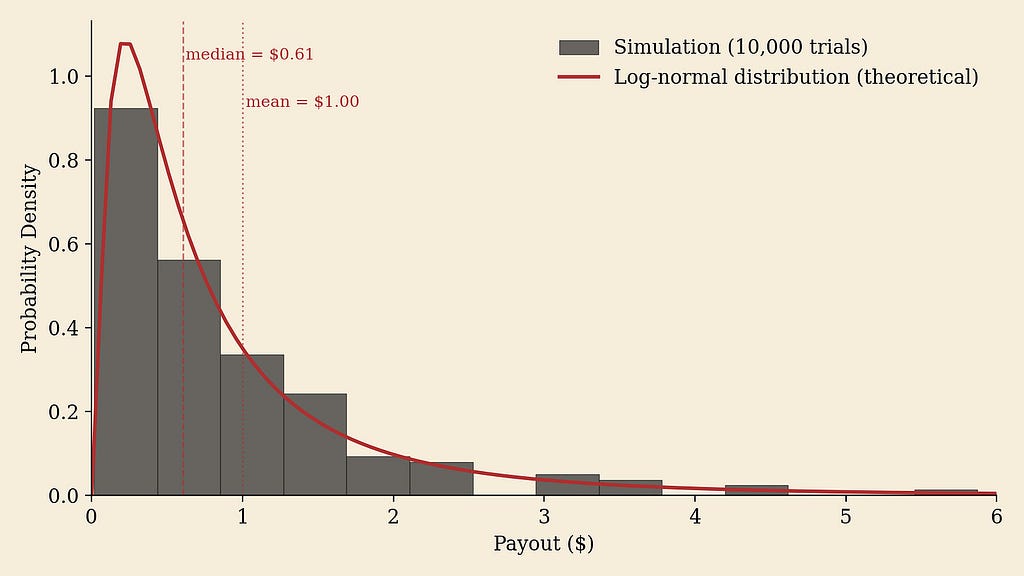
Game 2: Multiplicative payoffs with symmetric risk. You start with $1. For each of 100 flips, if you get heads, your current amount is multiplied by 1.1. If tails, it is multiplied by 0.9.
The expected value after any single flip is unchanged, because:

So the overall expected value of the game is $1.
But the distribution of outcomes is not normal. Because the payoffs are multiplicative rather than additive, the logarithm of the outcome is what accumulates additively. By the central limit theorem applied to log(X), the distribution of final values follows a log-normal distribution. The majority of players end up with less than $1 (the median is below the mean), and there is a long right tail of players who end up with significantly more. The game is fair in expectation but deeply asymmetric in practice.
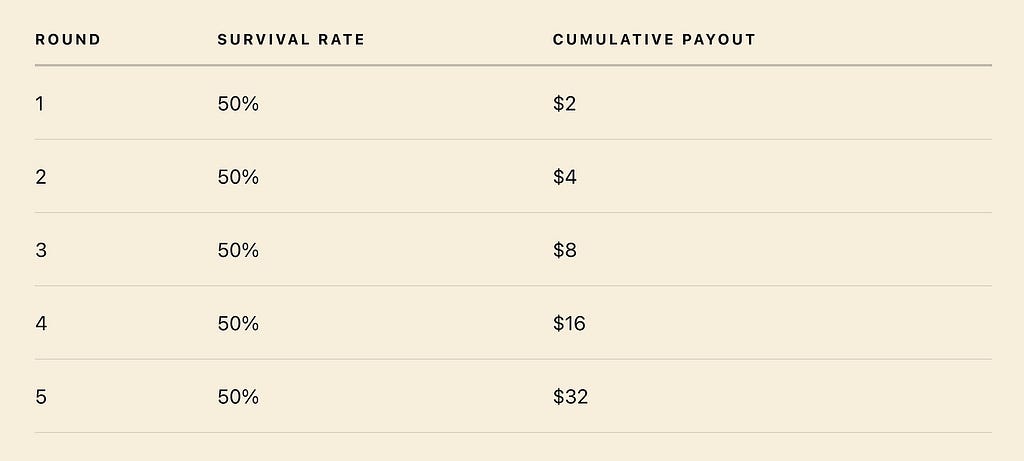
Game 3: Multiplicative payoffs with elimination. You start with $1. Each round, I double your money. You keep playing until you flip tails, at which point the game ends.
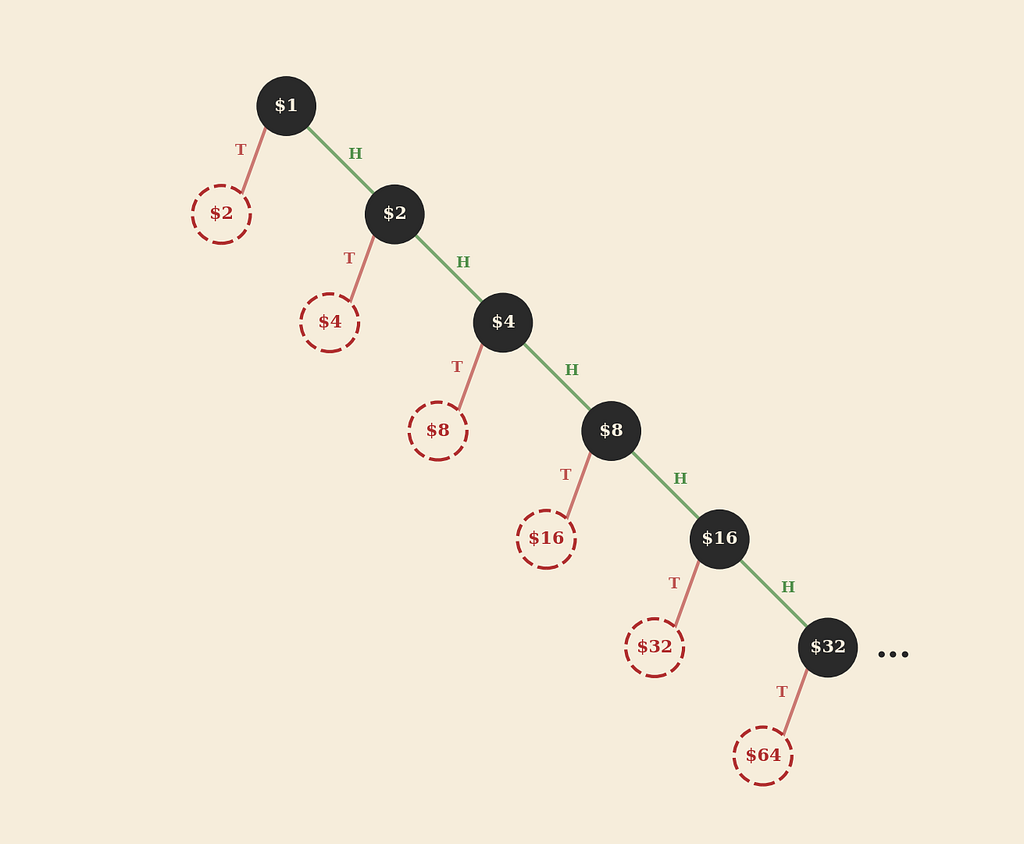
The probability of surviving exactly n rounds is (1 / 2^n), and the payout after n rounds is (2^n). If we try to compute the expected value of this game, each term in the series contributes equally:

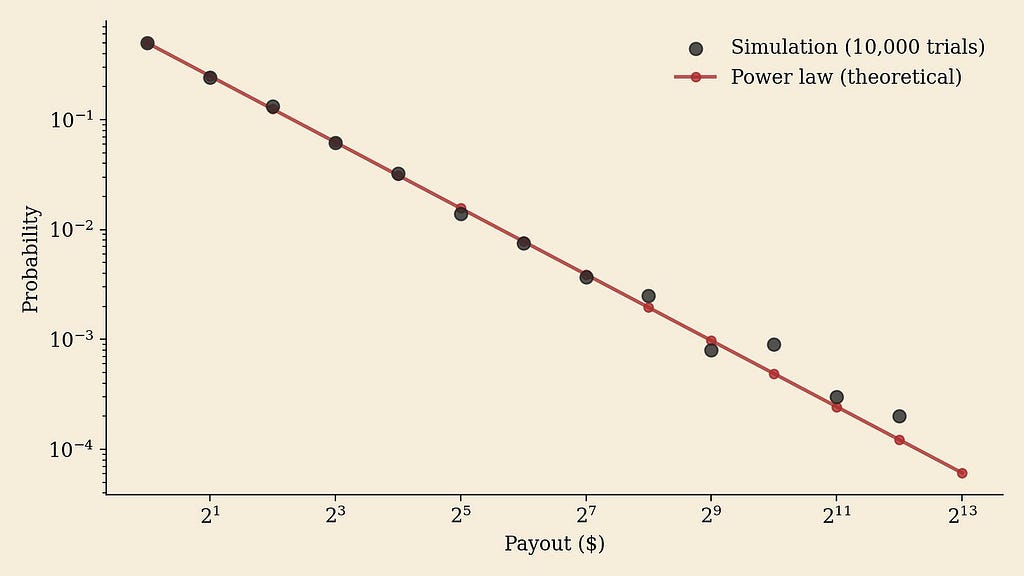
The expected value is infinite. This is the St. Petersburg paradox, famously analyzed by Daniel Bernoulli in 1738. More importantly for our purposes, we can directly derive the probability distribution for a payout x:
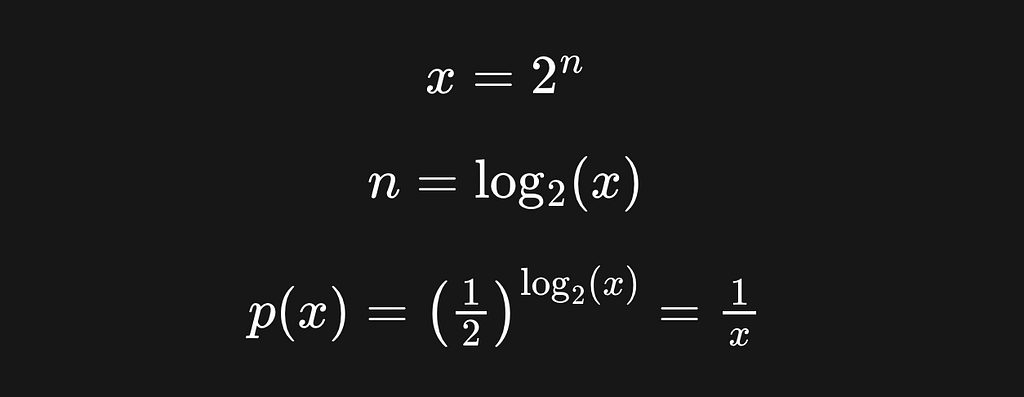
This is a power law, specifically a Pareto distribution with exponent α=1. The probability of an outcome x is inversely proportional to x itself.
A pareto distribution:

can also arise whenever the round-by-round multiplier is roughly inversely proportional to the probability of continuing the game. The third game used a fair coin and a doubling multiplier, but it generalizes easily. Consider a weighted coin where the probability of tails (elimination) is 2/3 and each surviving round triples your money. The probability of surviving n rounds is (1 / 3^n), and the payout is (3^n). Substituting, we get the same power law:

In fact, I could derive a power law from a far more convoluted set of rules. Round one might use a fair coin with a 2x multiplier, round two a weighted coin with a 3x multiplier, round three a differently weighted coin with a 1.5x multiplier, and so on. The specific numbers don’t matter. What matters is the structural relationship: the multiplier in each round is roughly inversely proportional to the probability of surviving that round. When that condition holds, the resulting distribution of outcomes is a power law.
The Venture Capital Coin Flip
Now consider the venture fundraising schedule through this lens. Each funding round is a “round” of the game. The company either survives to raise the next round or it does not. If it survives, its valuation increases by some multiplier. If it doesn’t, the game is over.
To make the comparison concrete, here is the coin-flip game with a fair coin and 2x multiplier:
And here is the approximate venture capital equivalent:
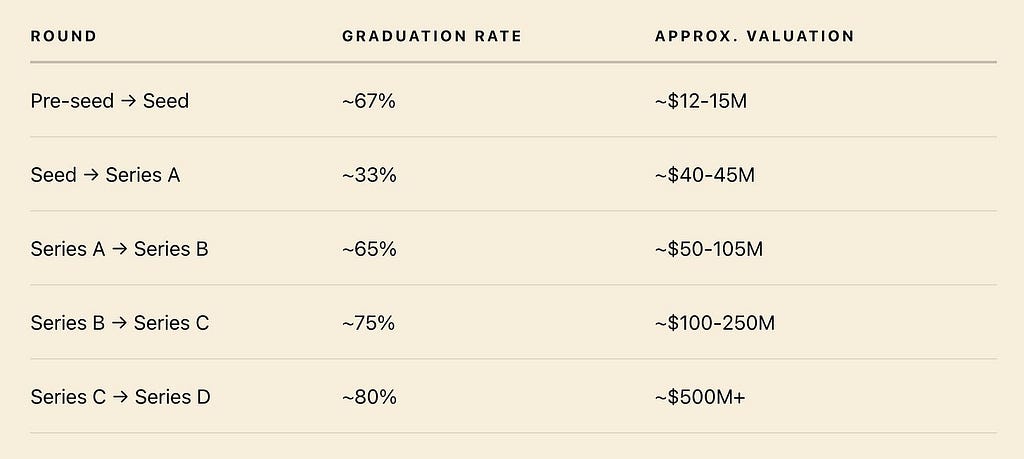
The coin-flip game has a uniform 50% survival rate and a uniform 2x multiplier. Venture capital is messier, but the qualitative pattern is the same. Multiplicative payoffs, compounded across multiple rounds, with elimination at each stage. The seed-to-Series-A transition has the lowest survival rate (~33%) and the largest valuation jump (~3x). Later stages have progressively higher survival rates (65%, 75%, 80%) but smaller relative valuation increases. The relationship between survival probability and valuation multiplier is roughly inverse: where the odds of advancing are worst, the payoff for surviving is greatest. That is Game 3, not Game 1 or 2.
I should be honest about what this comparison glosses over. The fundraise round size does not exactly equate to the company’s market value. A company might raise $20M at a $100M valuation, but that does not mean someone would pay $100M to acquire it. It just means that is the prospective valuation the founders and the venture firm agreed to. By the same logic, it’s not quite right to say that every company can “cash out” at its last valuation when it fails to raise the next round, the way a player in the coin-flip game walks away with their current payout when they flip tails. Valuation is not the same as market value.
This simplified model also ignores deal mechanics that matter in practice: pro rata rights, preferred stock, SAFEs, convertible notes, down rounds, bridge rounds, angel investors, and secondary markets. These are real and consequential features of the venture landscape, and I won’t pretend to account for all of them here.
But our simplified model of venture capital appears to correctly predict the key empirical phenomenon, the power law distribution of returns, via analogy with an even simpler model of coin-flip games. That is worth something, even if the model is imperfect.
Causation, Correlation, and the Chicken-or-Egg Problem
Is it possible that the venture fundraising schedule actually causes the power law distribution that it is supposedly built to capitalize on? It would be a mistake to conclude that because our simple model predicts the power law, the funding schedule must be the root cause. So let me take the opposing viewpoint and ask what other mechanisms could produce a power law in startup outcomes, independent of the funding structure.
One argument is that businesses themselves self-organize into a Pareto distribution through direct and indirect competition. Some companies are run more efficiently than others. Some founders are more resourceful. The quality of early employees can shape a company’s trajectory. Could this produce a power law on its own?
Recall the three coin-flip games. In order for a process to produce a power law rather than a normal or log-normal distribution, each successive stage needs to have a multiplicative, strictly positive effect on the company’s overall value.
If injecting capital leads only to an additive increase in company value (Game 1), venture investment is unlikely to be profitable.
- An aimless startup with no clear product-market fit, where more money simply buys more time without compounding value.
- A company that uses each round to fund an unrelated product line rather than building on its current traction — the returns add up, but they don’t compound.
- A services business that scales by adding headcount, where revenue grows linearly with bodies and capital buys capacity, not growth rate.
If capital injection is multiplicative but carries a meaningful chance of decreasing the company’s value (Game 2), the distribution of outcomes is log-normal at best, not a power law.
- A company with unclear leadership, where scaling up could multiply value or could turn the whole operation into a disorganized mess.
- A company whose customer acquisition cost exceeds lifetime value, where every dollar spent on growth actively destroys value.
- A company that scales headcount faster than its organization can absorb, where new hires multiply coordination overhead instead of output.
The expected outcome is still non-negative, but individual outcomes are often mediocre.
It’s only the companies where capital injection is a multiplicative, strictly positive force that generate power-law outcomes (Game 3). These are the companies with the strongest compositions, the most defensible competitive advantages, and the clearest leadership. When isolated from the rest, these companies could plausibly constitute a power law regardless of the specific funding schedule. Whether the rounds increase by 2x or 5x is beside the point. What matters is the underlying growth mechanics.
But the venture fundraising schedule preferentially eliminates the non-power-law companies. With each round, as investors learn more about a company’s product, leadership, and market dynamics, it becomes easier to identify which startups will not exhibit positive, multiplicative returns on invested capital. By the time a company reaches late-stage funding (Series C or beyond), theoretically only companies with power-law mechanics remain. Much of the remaining “survival rate” at that point comes down to external market factors and whose growth rate is the largest and most stable. In a sense, the venture fundraising schedule necessitates that the surviving companies follow a Pareto distribution.
Now consider the reverse. Suppose that in the early days of modern venture investing, many firms did not use the staged funding structure that exists today. Suppose firms wrote smaller, more conservative checks in exchange for less equity, with less pressure on companies to demonstrate rapid growth between rounds. Startup survival rates would have been higher (though formation rates would likely be lower), leading to a flatter, more log-normal distribution of outcomes.
In that world, the few investors who did recognize the power law of elite companies, and structured their investments accordingly, would have seen outsized returns. Their LPs would have noticed. Capital would have flowed toward those successful funds and away from the conservative ones. The investor ecosystem itself would self-correct, converging on the funding structure that maximizes for power-law outcomes.
The Uncomfortable Answer
Neither the funding schedule alone nor the startups alone produce the power law. It is the combination of the two.
The staged funding structure applies selective pressure, pruning companies that do not demonstrate multiplicative growth. The companies that survive apply pressure back, forcing investors to adapt their strategies or lose out on the best returns. The relationship between startups and investors is simultaneously collaborative and competitive. Each side shapes the other’s behavior, and a power law emerges from the tension between them.
That may be unsatisfying. We want clean causation, A causes B. But the honest answer is a feedback loop, and the power law is what falls out of it.
1) Round sizes and valuations from PitchBook-NVCA Venture Monitor and CB Insights State of Venture.
2) Graduation rates from Carta’s State of Private Markets reports. The ~33% seed-to-A figure reflects historical averages; Carta’s most recent data shows this chokepoint tightening further, with 2022–2023 cohorts graduating at closer to 15–20% within a 24-month window.
On Power Laws was originally published in DataDrivenInvestor on Medium, where people are continuing the conversation by highlighting and responding to this story.