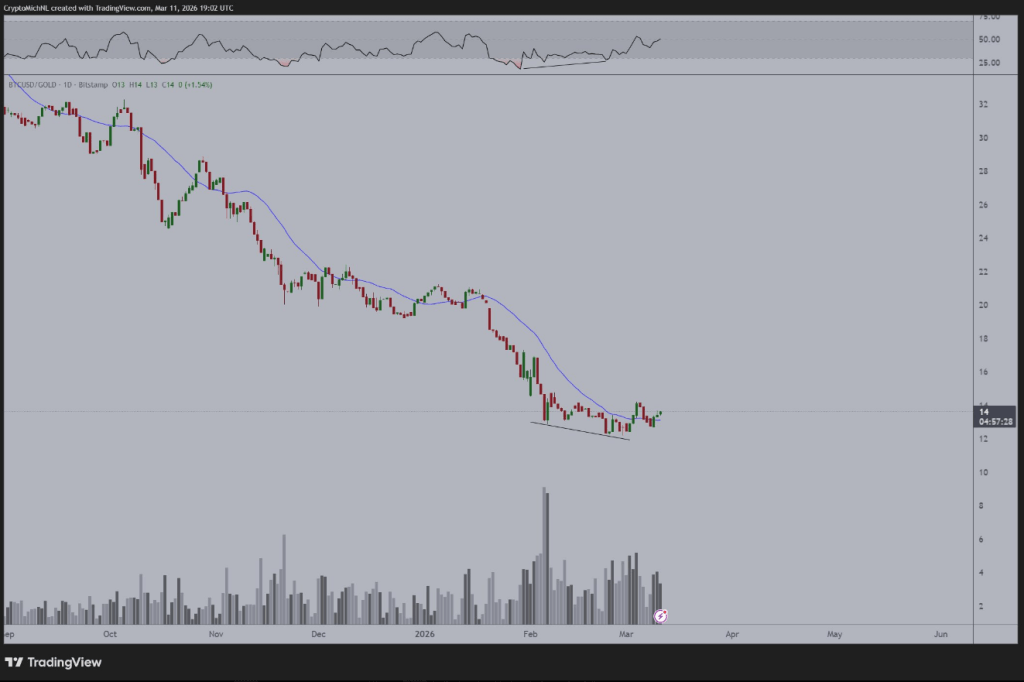
Bitcoin [BTC] has oscillated around the $70k level since the 10th of March. Despite macroeconomic market uncertainties, Bitcoin’s steady performance was encouraging. It showed some resilience, even though the longer-term trend remained bearish.
One reason was that the selling pressure from long-term holders was easing. The long-term holder sell-side risk ratio has fallen to October 2025 lows, indicating that LTHs have equal measures of profit and loss realization.
Although long-term holders’ selling pressure was easing, the higher timeframe Bitcoin momentum remained bearish. The current bounce could push toward $80k, but it must not catch investors by surprise.
On-chain “stress test” phase for Bitcoin
In a post on CryptoQuant Insights, an analyst pointed out the variety of conditions that need to be met to confirm a market bottom. Historically, these signals have accompanied a “max pain” period for long-term holders. They tended to mark the final capitulation before intense long-term accumulation could begin to drive prices higher.
Among the metrics to watch were the Realized Price for the 6-12 month holder cohort and the MVRV ratio.

The Realized Price- UTXO age bands metric reveals the average cost basis of different groups of buyers, based on how long they have been holding Bitcoin.
The analyst pointed out that, historically, the realized price bands need to flatten their curve. In other words, the price needs a long consolidation phase to allow the average cost basis bands to drop.
The 6-12-month band highlighted heavy supply overhead. The current Bitcoin resilience likely won’t mature into a full recovery because of this.

Another factor was the MVRV ratio, which was at 1.29 at the time of writing. Historically, these values were a DCA zone for smart money but did not mark the worst of the bear cycle.
MVRV values below 1 were needed to signal capitulation and max pain. We are yet to reach this point of maximum despair.
The two paths to a Bitcoin bottom

Interestingly, the analyst also laid out the two paths to a Bitcoin market bottom for this cycle. It could take the form of a black swan event. Alternatively, institutional capital flow could keep Bitcoin suspended between $60k and $80k for a “boring” year, exhausting investor patience.
The MVRV pricing bands seem to be following the previous cycle trends. It was below the 0.5 standard deviation (dotted blue) at 1.41 but had yet to reach the cycle-bottom depths that the -1SD represented.
To reach this, MVRV values of 0.909 or lower would be needed. Both the December 2018 and November 2022 cycle bottoms fell below the lows of the pricing bands before recovering.
If the same scenario plays out again, Bitcoin could dip below $50k for a few weeks to inflict max pain upon long-term investors before recovering.
Final Summary
- Bitcoin exhibited some strength by staying above $70k, while global market indices posted losses.
- The current bounce was within a broader bearish regime. Investors should not bet on a long-term recovery yet.
Akashnath S
JournalistAkashnath S is a Senior Journalist and Technical Analysis expert at AMBCrypto. He specializes in dissecting price action, identifying key market trends through advanced chart patterns, and forecasting both short-term and long-term asset trajectories.