Liquidation Map: How to Identify the Liquidity the Market May Target
 Trading Different3 min read·Just now
--
Most traders focus on price.
More advanced traders focus on something different:
The liquidity around price.
Because the market does not move randomly.
Behind every move, there is a structural reason:
The search for liquidity.
One of the most effective ways to visualize this is through the Liquidation Map by Trading Different.
This tool helps you identify price levels where there is a high concentration of leveraged positions at risk of being liquidated, allowing you to understand which levels may become natural targets for the market.
What is the Liquidation Map?
The Liquidation Map is a tool that shows the estimated distribution of potential liquidations across different price levels.
Its purpose is to reveal where leveraged exposure is concentrated in the market.
In simple terms:
It shows you where a large number of positions could be forced to close if price reaches certain levels.
This gives you something that price alone cannot show:
Where liquidity is concentrated and where the market may move toward.
Why Liquidity Matters
Markets need liquidity to move.
When many leveraged positions are clustered at certain levels, those areas become important because they can trigger liquidation cascades.
When liquidations happen:
- Volatility increases
- Executed volume rises
- Price can accelerate
That’s why understanding where liquidity is positioned helps you better read the real structure of the market.
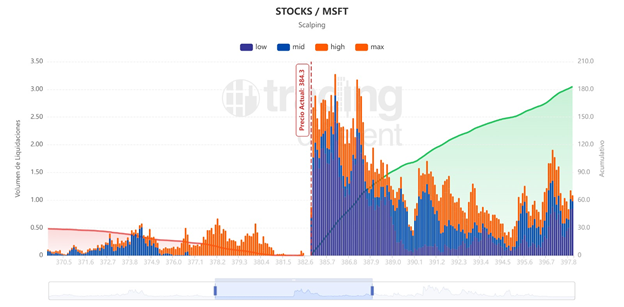
How to Read the Liquidation Map
The Liquidation Map visually organizes potential liquidation zones above and below the current price.
Each bar represents an estimate of accumulated liquidations at a specific price level.
General interpretation:
- Higher bars: More concentrated liquidations
- More accumulation: More relevant liquidity zone
- Current price: Reference to measure distance to liquidity
This helps you quickly identify the most important areas in the market structure.
Scalping Mode — Short-Term Liquidity
In Scalping mode, the Liquidation Map focuses on higher leverage positions that are closer to the current price.
This setup allows you to analyze:
- Liquidity near the current price
- Pools relevant for intraday movements
- Short-term reaction zones
It works with leverage levels such as:
- 10x
- 25x
- 50x
- 100x
This makes it ideal for:
- Scalping
- Day trading
- High-frequency trading
In short timeframes:
Nearby liquidity has the most impact.
Swing Mode — Larger Structural Liquidity
The Swing version expands the analysis range to include lower leverage positions and larger market structure.
This helps identify:
- Liquidity pools further away from price
- Medium to long-term targets
- Key zones for swing trading
It includes leverage levels such as:
- 3x
- 5x
- 10x
- 25x
While Scalping mode focuses on immediate liquidity,
Swing mode helps you see the broader structure.
The Same Behavior Exists in Other Markets
Liquidity is not exclusive to crypto.
The same behavior can be observed in other financial markets.
This makes the Liquidation Map useful for analyzing:
- Cryptocurrencies
- Stocks
- Indices
- Forex
- Other leveraged markets
Because even if the asset changes…
The underlying market behavior remains the same.
What Advantage Does It Give You?
The Liquidation Map is not designed to predict the market.
It is designed to give you better context.
Used correctly, it can help you:
- Identify important market zones
- Understand where risk is concentrated
- Spot potential acceleration areas
- Improve how you define targets
It does not replace a strategy.
But it gives you an additional layer of information that most traders do not see.
Conclusion
The market changes in form, asset, and speed…
But it never changes its objective: liquidity.
And the Liquidation Map by Trading Different allows you to see where that liquidity is before price gets there.
Because understanding price is useful.
But understanding what attracts price
takes your analysis to another level.
