Investors love data.
But most investors hate collecting it.
If you’ve ever tried to analyze companies using financial statements, you know the problem:
- Financial reports are scattered across PDFs, filings, and websites
- Manually calculating ratios takes hours
- Screening hundreds of companies becomes nearly impossible
So what do most investors end up doing?
They analyze only a handful of stocks.
And that creates a massive disadvantage.
Because professional investors don’t analyze 10 companies.
They analyze thousands.
The difference isn’t intelligence.
It’s automation.
This is where a financial statements API becomes incredibly powerful.
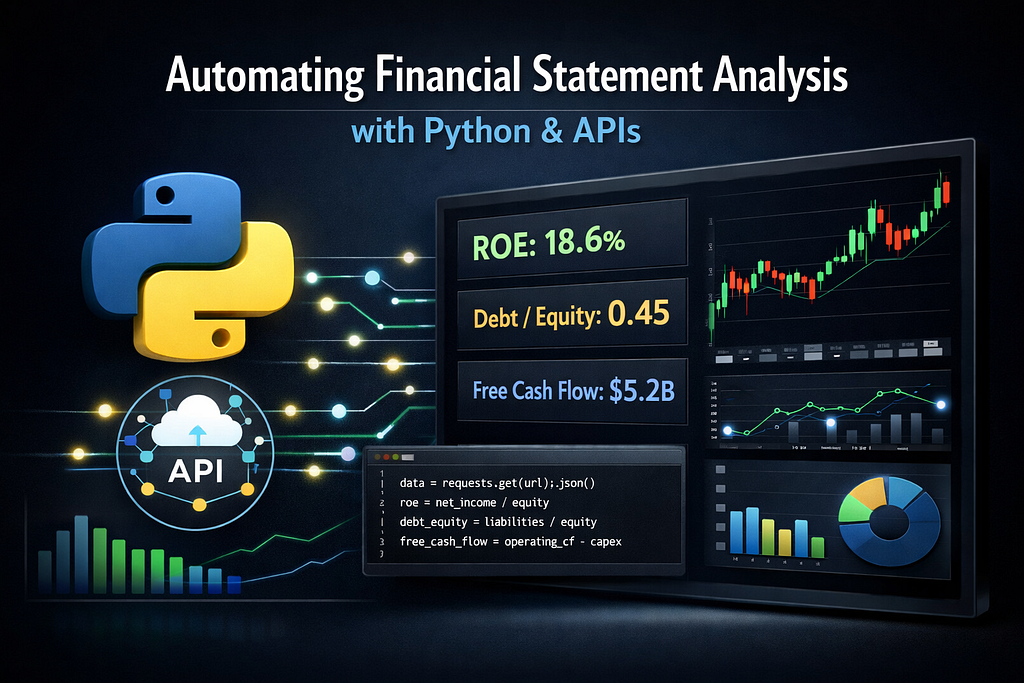
Instead of manually gathering balance sheets, income statements, and cash flow data, you can access everything programmatically — and build automated screening systems that identify opportunities in seconds.
In this guide, you’ll learn:
- What a financial statements API is
- How to extract company financial data using Python
- How to automatically calculate key investment ratios
- How to build a simple stock screening tool
- What to consider when choosing a financial data API
Let’s start with the fundamentals.
What Is a Financial Statements API?
A financial statements API allows developers and investors to access structured financial data programmatically.
Instead of downloading financial reports manually, you can retrieve:
- Income statements
- Balance sheets
- Cash flow statements
- Financial ratios
- Historical financial data
All through simple API requests.
This allows you to automate:
- company analysis
- portfolio screening
- quantitative investing strategies
- financial dashboards
One of the most practical platforms for this is the Financial Modeling Prep API (FMP), which provides structured access to financial statements for thousands of companies.
Why Automating Financial Analysis Matters
Manual analysis has three major limitations:
1. Time
Reading and calculating ratios for a single company might take 15–20 minutes.
Analyzing 500 companies manually would take weeks.
2. Human Bias
Manual analysis often leads to:
- emotional decisions
- confirmation bias
- inconsistent evaluation criteria
Automation enforces consistent rules.
3. Lack of Scale
Professional investors rely on screening systems like:
- ROE filters
- debt ratio limits
- free cash flow screens
These systems require automated data pipelines.
And that’s exactly what APIs enable.
Getting Financial Statements with Python
First, install the required libraries.
pip install requests pandas
Now let’s retrieve financial statement data.
import requests
import pandas as pd

API_KEY = "YOUR_API_KEY"
symbol = "AAPL"

url = f"https://financialmodelingprep.com/api/v3/income-statement/{symbol}?apikey={API_KEY}"

response = requests.get(url)
data = response.json()

df = pd.DataFrame(data)

print(df[['date','revenue','netIncome','eps']].head())
With just a few lines of code, you now have structured financial data ready for analysis.
Calculating Key Investment Ratios Automatically
Once financial statements are retrieved, you can compute investment ratios.
These ratios help investors evaluate profitability, leverage, and efficiency.
Return on Equity (ROE)
Measures how efficiently a company generates profits from shareholder equity.
ROE = Net Income / Shareholder Equity
income_url = f"https://financialmodelingprep.com/api/v3/income-statement/{symbol}?apikey={API_KEY}"
balance_url = f"https://financialmodelingprep.com/api/v3/balance-sheet-statement/{symbol}?apikey={API_KEY}"

income = requests.get(income_url).json()[0]
balance = requests.get(balance_url).json()[0]

net_income = income["netIncome"]
equity = balance["totalStockholdersEquity"]

roe = net_income / equity

print("ROE:", round(roe*100,2),"%")
A high ROE (>15%) is often associated with high-quality businesses.
Debt-to-Equity Ratio
This ratio helps investors understand financial risk.
Debt to Equity = Total Liabilities / Shareholder Equity
Python example:
debt = balance["totalLiabilities"]
equity = balance["totalStockholdersEquity"]

de_ratio = debt / equity

print("Debt to Equity:", round(de_ratio,2))
Investors typically prefer companies with:
Debt to Equity < 1
Although it depends on the industry.
Free Cash Flow
Free Cash Flow is one of the most important metrics in fundamental investing.
Free Cash Flow = Operating Cash Flow — Capital Expenditures
cashflow_url = f"https://financialmodelingprep.com/api/v3/cash-flow-statement/{symbol}?apikey={API_KEY}"

cashflow = requests.get(cashflow_url).json()[0]

operating_cf = cashflow["operatingCashFlow"]
capex = cashflow["capitalExpenditure"]

free_cash_flow = operating_cf - capex

print("Free Cash Flow:", free_cash_flow)
Companies with growing free cash flow often have strong long-term investment potential.
Building a Simple Stock Screening Tool
Now let’s combine everything into a basic investment screener.
The idea:
Filter companies with:
- ROE > 15%
- Debt-to-Equity < 1
- Positive Free Cash Flow
Example:
symbols = ["AAPL","MSFT","GOOGL","META"]

results = []

for symbol in symbols:

    income_url = f"https://financialmodelingprep.com/api/v3/income-statement/{symbol}?apikey={API_KEY}"
    balance_url = f"https://financialmodelingprep.com/api/v3/balance-sheet-statement/{symbol}?apikey={API_KEY}"
    cashflow_url = f"https://financialmodelingprep.com/api/v3/cash-flow-statement/{symbol}?apikey={API_KEY}"

    income = requests.get(income_url).json()[0]
    balance = requests.get(balance_url).json()[0]
    cashflow = requests.get(cashflow_url).json()[0]

    roe = income["netIncome"] / balance["totalStockholdersEquity"]
    debt_equity = balance["totalLiabilities"] / balance["totalStockholdersEquity"]
    fcf = cashflow["operatingCashFlow"] - cashflow["capitalExpenditure"]

    if roe > 0.15 and debt_equity < 1 and fcf > 0:
        results.append(symbol)

print("Stocks passing the filter:", results)
This simple script already demonstrates how investors can move from raw financial statements to automated investment decisions.
And the more companies you analyze, the more powerful this approach becomes.
Creating a Simple Financial Analysis Dashboard
You can take this one step further by building a simple dashboard using Streamlit.
pip install streamlit
Example:
import streamlit as st
import pandas as pd
import requests

st.title("Financial Ratio Analyzer")

symbol = st.text_input("Enter Stock Symbol", "AAPL")

if symbol:

    url = f"https://financialmodelingprep.com/api/v3/ratios/{symbol}?apikey={API_KEY}"

    data = requests.get(url).json()[0]

    st.metric("Return on Equity", round(data["returnOnEquity"]*100,2))
    st.metric("Debt to Equity", data["debtEquityRatio"])
    st.metric("Free Cash Flow per Share", data["freeCashFlowPerShare"])
This creates a mini financial analysis application where investors can instantly evaluate a company.
What to Look for When Choosing a Financial Statements API
Not all APIs provide the same quality of data.
Here are some key factors investors should evaluate:
Data Coverage
Check whether the API includes:
- US stocks
- international markets
- ETFs
- financial ratios
Historical Depth
For quantitative investing, historical financial statements are essential.
Some APIs provide 10–20 years of data, which is extremely valuable for backtesting.
Reliability
Financial models require consistent data.
A good API should provide:
- stable endpoints
- clean JSON responses
- minimal downtime
Developer Experience
A well-designed API should include:
- clear documentation
- structured endpoints
- predictable responses
FMP is widely used by developers and analysts because it provides all these features with simple REST endpoints.
Why Many Developers Use the FMP API
The Financial Modeling Prep API is particularly popular among developers building financial tools because it offers:
- access to financial statements
- company fundamentals
- financial ratios
- market data
- historical price data
All accessible via straightforward API calls.
This makes it ideal for:
- investment research tools
- automated screeners
- portfolio analytics dashboards
- quantitative strategies
If you want to experiment with financial automation yourself, you can explore the API here:
Try the Financial Modeling Prep API
FAQ: Financial Statements API
What is a financial statements API?
A financial statements API provides programmatic access to company financial data such as income statements, balance sheets, and cash flow statements. Instead of manually downloading financial reports, investors and developers can retrieve structured financial data using API calls.
This allows users to automate financial analysis, build stock screeners, and create investment dashboards.
Why use a financial statements API for investing?
Using a financial statements API allows investors to analyze large numbers of companies quickly and consistently.
Instead of manually calculating ratios, investors can automate metrics such as:
- Return on Equity (ROE)
- Debt-to-Equity ratio
- Free Cash Flow
- Profit margins
This makes it easier to build systematic investment strategies and quantitative screening systems.
Can I analyze financial statements using Python?
Yes. Python is one of the most popular languages for financial data analysis.
With libraries like:
- requests
- pandas
- streamlit
investors can easily retrieve financial statement data from an API and build tools for:
- stock screening
- financial dashboards
- automated analysis
What financial data can you get from a financial statements API?
Most financial statement APIs provide access to:
- Income statements
- Balance sheets
- Cash flow statements
- Financial ratios
- Company fundamentals
- Historical financial data
This information is essential for performing fundamental analysis and evaluating investment opportunities.
What is the best financial statements API?
Several APIs provide financial statement data, but many developers use Financial Modeling Prep (FMP) because it offers:
- structured financial statement data
- financial ratios
- historical financial data
- easy-to-use REST endpoints
This makes it ideal for building financial analysis tools and investment research applications.
Final Thoughts
Financial statements are the foundation of fundamental investing.
But manually analyzing them limits both speed and scale.
By using a financial statements API, investors can:
- automate ratio analysis
- screen thousands of companies
- build custom financial dashboards
- develop systematic investment strategies
In other words, APIs transform financial analysis from a manual process into a scalable system.
And in modern markets, systems beat spreadsheets every time.
How to Use a Financial Statements API to Automate Investment Analysis with Python was originally published in Coinmonks on Medium, where people are continuing the conversation by highlighting and responding to this story.


