How to Find What’s Actually Costing You Money in Futures Trading
 The Edge Ghost4 min read·Just now
--
Most futures traders know they should review their trades, but few know what to look for.
You can have a journal full of trades and still not know why your account is growing or shrinking. Win rate and profit factor help describe performance, but they rarely explain it.
Many intraday traders run into the same questions:
- Why am I losing money even with a decent win rate?
- Are my losses too big?
- Am I risking more than I think?
- Are a few big trades carrying my results?
- Which trades should I actually review?
Most journals make traders dig through hundreds of trades to find those answers.
The real problem is not a lack of data. It is a lack of clarity.
This is where structured behavioral analysis becomes useful.
The Problem With Traditional Trading Journals
Most trading journals focus on statistics like:
- Win rate
- Average win and loss
- Profit factor
- Equity curve
These numbers describe performance, but they do not explain behavior.
A trader might see:
- Win rate: 48%
- Profit factor: 1.2
That does not answer the important question:
What exactly is affecting my results?
Many futures traders discover their biggest problems only after months of manual analysis. They eventually notice patterns like:
- Losses getting larger after the first losing trade
- Position size creeping higher during volatile sessions
- Winners getting cut early
- Stops getting moved
These patterns usually exist long before traders notice them.
Manual journaling makes those patterns difficult to see.
Turning Trading Mistakes Into Dollar Amounts
One of the most effective ways to understand trading behavior is to express mistakes in dollars instead of percentages.
It is easy to ignore a statistic like:
Average loss: 1.3R
It is much harder to ignore:
Moving stops cost you $437 this month.
Dollar-based analysis makes discipline measurable.
Instead of general observations, traders can see the exact financial impact of specific behaviors.
Examples of measurable insights include:
- Oversizing trades
- Losses exceeding planned stops
- Profit dependence on large winners
- Distribution of trade outcomes
When trading behavior is expressed in dollars, it becomes actionable.
Execution-Based Insights for Futures Traders
The EdgeGhost Insights tab was designed to answer a simple question:
- What trading behaviors are making or costing me money?
Instead of relying on manual tagging or subjective notes, the system analyzes execution data directly.
Trade fills are converted into standardized R-multiples based on planned risk.
This allows consistent analysis across:
- Different instruments
- Different position sizes
- Different account sizes
The result is a structured view of trading behavior built from actual executions.
You can explore the Insights tab here:
https://edgeghost.com/insights
Identifying the Biggest Problems First
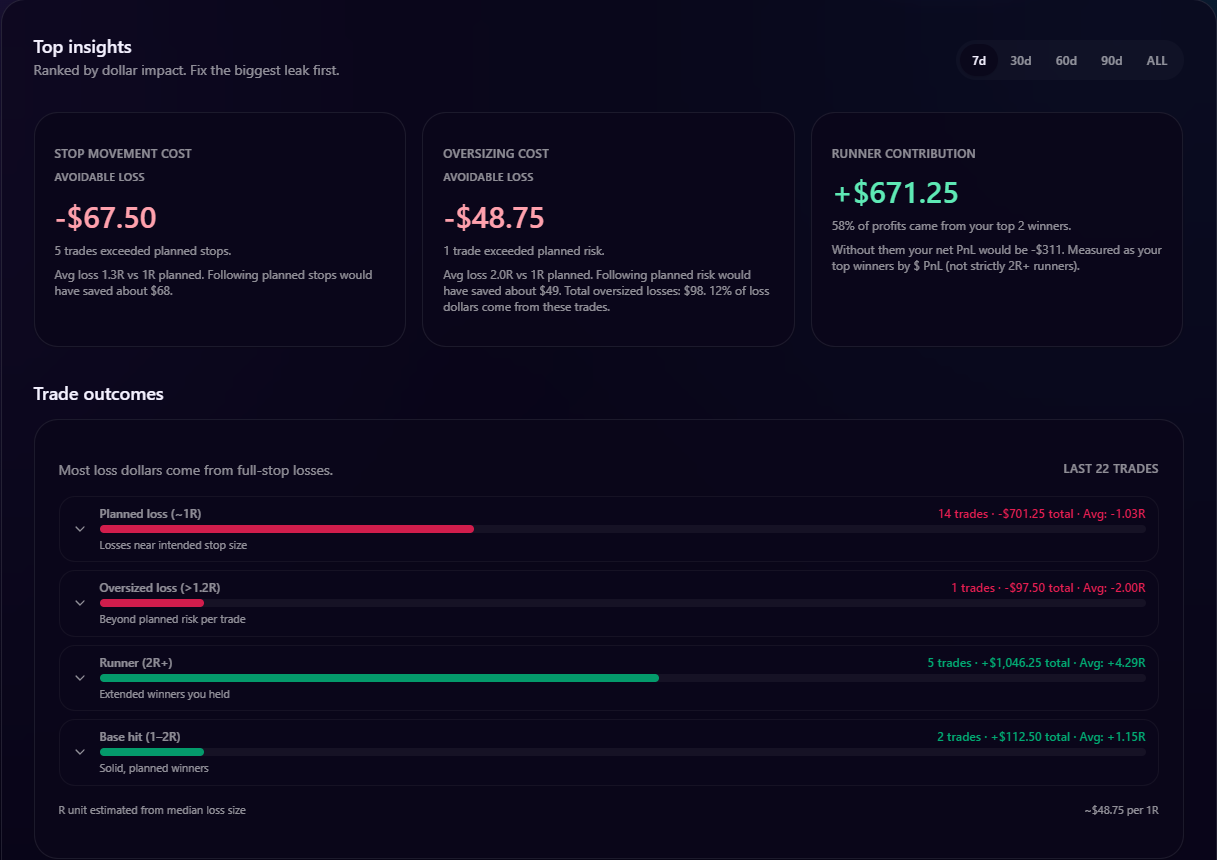
The Top Insights section highlights the behaviors with the largest dollar impact.
Instead of scanning dozens of charts and tables, traders can immediately see where discipline breaks down.
Oversizing Cost
This identifies trades where risk exceeded the planned size.
It shows:
- Total losses from oversized trades
- Number of trades involved
- Average loss compared to planned risk
- How much could have been saved by following position sizing rules
Many intraday futures traders discover that a small number of oversized trades account for a large percentage of losses.
Stop Movement Cost
This identifies trades where losses exceeded planned stop levels.
It shows:
- Total avoidable losses
- Number of trades affected
- Average loss compared to planned risk
- Dollar amount that could have been saved
Moving stops is one of the most common discipline problems in intraday futures trading.
Seeing the exact dollar impact makes the behavior difficult to ignore.
Runner Contribution
This insight shows how much profits depend on large winning trades.
It shows:
- Dollar contribution from top trades
- Percentage of profits from those trades
- What results would look like without them
Many traders discover that a small number of runners produce most of their profits.
Understanding this helps traders avoid cutting winners too early.
Understanding Trade Outcomes in Futures Trading
The Trade Outcomes section provides supporting detail behind the insights.
Trades are grouped by performance relative to planned risk.
Oversized Loss (>1.2R)
These are trades where losses exceeded planned risk significantly.
This helps identify risk management problems.
Planned Loss (~1R)
These trades stayed close to the planned stop.
This shows disciplined risk management.
Runner (2R+)
These are large winning trades.
They help reveal how profits are generated.
Base Hits and Small Wins
These represent moderate profits.
They help traders understand how consistency contributes to results.
Reviewing Trades Without Guesswork
Each trade category is clickable.
Instead of seeing a summary like:
- Oversized losses cost $951
Traders can immediately open the trades behind the numbers.
From there they can:
- Review executions
- Add notes
- Tag trades
- Open full trade details
This makes the review process concrete instead of abstract.
Why This Matters for Intraday Futures Traders
Futures trading requires tight risk control.
Small discipline mistakes compound quickly.
Many traders do not fail because of poor setups. They fail because of inconsistent execution.
Structured insights help traders:
- Identify discipline problems faster
- Focus review time efficiently
- Understand profit drivers
- Improve consistency
Instead of guessing what went wrong, traders can see measurable results.
A Better Way to Review Trading Performance
Trade history by itself is just raw data.
Insights turn that data into direction.
The goal is not to produce more statistics. The goal is to make review practical and repeatable.
Execution review is where consistency develops.
You can explore the Insights feature here: