Most retail options traders know the frustration: you’re long calls, the chart is behaving, and then a large move blows through your position. Only afterward do you realize the options tape was screaming institutional activity for hours before it happened.
I spent the last few months building a system to detect this activity in real-time. This post explains how it works, the statistical methods behind it, and how to run it yourself.
The code is part of trading-skills, an open source Claude extension for AI-powered options analysis capabilities.
The problem with conventional “unusual activity” tools
Every retail options platform offers some form of unusual activity alerts. Most of them are wrong in the same ways.
The standard approach flags contracts where daily volume exceeds some multiple of open interest. That catches some real signals, but has three structural problems:
- Timing is lost. A $10M block placed at 9:31am is indistinguishable from 10,000 retail trades spread across the session. Both show up as “high volume” at end of day.
- Retail noise dominates. On liquid underlyings like NVDA or GOOG, statistically some contracts will trigger volume alerts every day for purely random reasons.
- Volume is the wrong metric. Institutions routinely buy deep in-the-money options — high premium per contract, low contract count. A single entity buying 200 deep ITM contracts at $150 premium has deployed $3M. It barely moves the volume chart. Meanwhile, 10,000 retail traders buying $0.30 OTM lotto tickets registers as a “volume spike.”
What actually signals institutional conviction is dollars invested.
The key data source: per-second options bars
The core ingredient is 1-second aggregation bars for options contracts. Massive.com (formerly Polygon.io, which many algo traders will recognize) provides exactly this through their aggregated bars API.
Their Starter plan covers options data at around $29/month. Given the decisions you’re making on it, that’s one of the cheaper edges available to retail traders. The Python client is clean:
from massive import RESTClient

client = RESTClient(api_key="your_key_here")

for bar in client.list_aggs(
    "O:NVDA260320C00180000",  # option ticker format
    1,                         # multiplier
    "second",                  # timespan
    "2026-03-17",              # from
    "2026-03-17",              # to
    adjusted="true",
    sort="asc",
    limit=50000,
):
    print(bar.timestamp, bar.vwap, bar.volume, bar.transactions)
Each bar includes VWAP, contracts traded, and — critically — transactions: the number of individual trades that composed the bar. If transactions == 1 and volume == 2000, that's a single block trade. There is no ambiguity.
Step 1: Pre-filter with Yahoo Finance
Before hitting the Massive API for every contract on a liquid underlying (which can mean thousands of strikes × expiries), I do a cheap screen using Yahoo Finance option chains via yfinance. This is free, no API key required.
Goal: find contracts with anomalously large dollar invested on the most recent trading day.
from trading_skills.options import get_expiries, get_option_chain
from trading_skills.utils import latest_trading_date
from dateutil.relativedelta import relativedelta
from datetime import date
import pandas as pd

UNDERLYING = "NVDA"
MAX_MONTHS = 2       # only near-term expiries
SIGMA = 3.0          # outlier threshold

ref_date = latest_trading_date()
expiry_max = ref_date + relativedelta(months=MAX_MONTHS)

rows = []
for expiry in get_expiries(UNDERLYING):
    if date.fromisoformat(expiry) > expiry_max:
        continue
    chain = get_option_chain(UNDERLYING, expiry)
    if "error" in chain:
        continue
    for opt_type, contracts in [("call", chain["calls"]), ("put", chain["puts"])]:
        for c in contracts:
            rows.append({**c, "expiry": expiry, "type": opt_type})

df = pd.DataFrame(rows)

# Filter to contracts that actually traded today (or previous session)
df["tradeDate"] = (
    pd.to_datetime(df["lastTradeDate"], utc=True)
    .dt.tz_convert("America/New_York")
    .dt.date
)
prev_date = ref_date - pd.offsets.BDay(1)
df = df[df["tradeDate"].isin([ref_date, prev_date.date()])].copy()

# Dollar invested = lastPrice × volume × 100
df["invested"] = (df["lastPrice"].fillna(0) * df["volume"].fillna(0) * 100).round(2)
active = df[df["invested"] > 0].copy()

# Flag outliers: invested > median + sigma * std
median_inv = active["invested"].median()
threshold = median_inv + SIGMA * active["invested"].std()
candidates = active[active["invested"] > threshold].sort_values("invested", ascending=False)

print(f"Found {len(candidates)} candidates from {len(active)} active contracts")
This narrows 400–800 contracts to 5–15 candidates. Those get the per-second treatment.
Step 2: Per-second whale detection
For each candidate, pull all 1-second bars from Massive and find the seconds with anomalous dollar investment:
from trading_skills.massive.whales import option_whales

CONTRACT = "O:NVDA260410C00180000"
DATE = "2026-04-02"

whales, all_bars = option_whales(CONTRACT, trading_date=DATE, return_all=True)

print(f"Total seconds with data: {len(all_bars)}")
print(f"Whale seconds detected: {len(whales)}")
print(whales[["timestamp", "close", "volume", "transactions", "invested", "break_even"]])
break_even is the underlying price at expiry where the trade is flat: for calls, strike + premium; for puts, strike - premium. It's a quick proxy for how far the stock needs to move for the institution to profit.
The detection algorithm
Naive thresholding breaks down on thinly-traded contracts because investment distributions are wildly non-Gaussian. I use a two-method adaptive approach based on sample size.
Small samples (n < 30 active bars): Modified Z-Score
When few bars have positive investment, the standard deviation is unstable. A single large value inflates σ — which raises the threshold and obscures the very event you’re trying to find. The Modified Z-Score (Iglewicz & Hoaglin, 1993) uses MAD (Median Absolute Deviation) instead:
MAD = median(|xi − median(x)|)
Mzi = 0.6745 × (xi − median(x)) / MAD
Flag as whale if Mzi > sigma_z (default 3.5). The 0.6745 factor makes MAD equivalent to σ on normally-distributed data, so the threshold is on the same scale as a standard-deviation cutoff - but far more resistant to contamination from the outlier you're trying to detect.
Large samples (n ≥ 30): median + sigma × std
With enough data, σ stabilizes. Using median as center (not mean) keeps it robust against the skewed distribution:
mask = df["invested"] > df["invested"].median() + sigma * df["invested"].std()
Hard rules that override the statistics
Two rules apply regardless of sigma:
Always whale: Any bar where invested / transactions >= $1,000,000 - one block trade of $1M or more. No statistical test needed. This is definitionally institutional.
Never whale: Any bar where invested / transactions <= $100,000 is dropped even if it passes the statistical test. Many small trades summing to a large total aren't whale activity; this removes that noise.
The full pipeline: whales_hunter()
Both steps are wrapped in one function:
from trading_skills.massive.whales import whales_hunter

result = whales_hunter(
    "NVDA",
    max_months=2,       # expiry window
    precise=True,       # use Massive per-second data
    sigma=3.0,
    sigma_z=3.5,
    trading_date=None,  # defaults to latest trading day
)

print(f"Source: {result['source']}")          # "massive" or "yahoo only"
print(f"Trading date: {result['trading_date']}")
print(f"Whale events: {result['total_whales']}")

import pandas as pd
whales_df = pd.DataFrame(result["whales"])
print(whales_df[["timestamp", "ticker", "type", "strike",
                  "close", "volume", "transactions", "invested", "break_even"]])
Without a Massive API key, the function falls back to Yahoo-only results — daily resolution, no per-second breakdown. Still useful for screening, less useful for timing.
Real example: live output from today (2026–04–02)
Here’s actual output from a morning run on NVDA and NBIS. Spot prices at time of analysis: NVDA $176.51, NBIS $107.05.
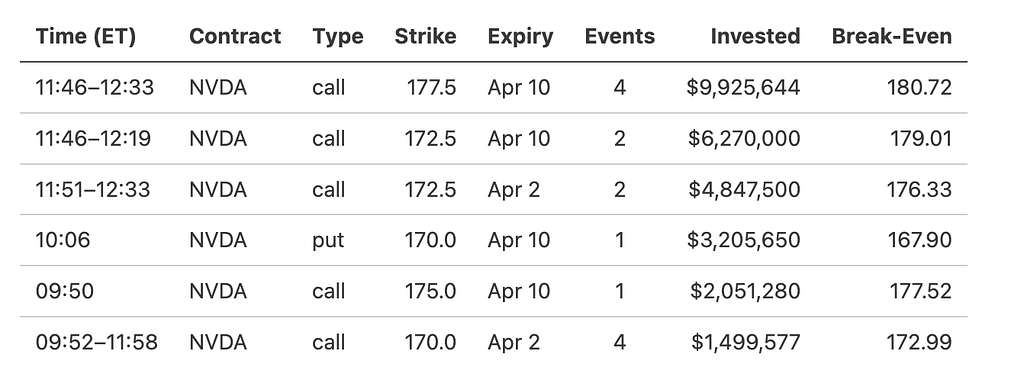
NVDA — Aggressive bullish call stacking
19 whale events. $26.3M calls vs. $3.2M puts. C/P ratio: 8.21.
The dominant theme: institutions accumulating Apr 10 calls at the 172.5 and 177.5 strikes. The 177.5 strike alone saw $9.9M across 4 events — just above current spot, a high-conviction near-term directional bet.
Separately, $4.8M flowed into today’s 172.5 calls. At spot $176.51, those are deep ITM (delta ~0.90+). That’s not leverage hunting — that’s someone paying for near-stock exposure through options, either to avoid moving the stock price or because of position limits on shares. Classic high-conviction ITM play.
The only put position: $3.2M in Apr 10 170p — below spot, almost certainly portfolio hedging.

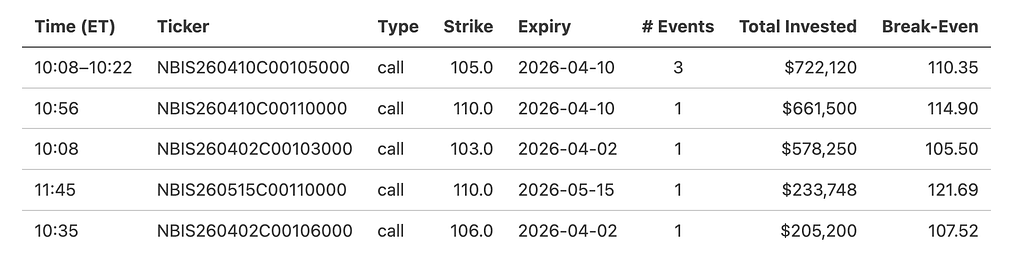
NBIS — Pure bullish call buying, zero puts
7 whale events. $2.4M calls. No put activity whatsoever.
Three tranches of Apr 10 105c placed between 10:08–10:22am — likely the same entity accumulating in pieces. The Apr 10 110c ($661K, break-even $114.90) requires a ~7% move by next Friday. The May 15 110c ($234K, break-even $121.69) extends the thesis six weeks out.
The Apr 2 103c bought this morning (break-even $105.50) are now deep ITM at spot $107.05. Whoever put on $578K there had conviction before the open.
What’s next
- Multi-symbol scanning — run across a watchlist, sort by total whale dollars
- Historical backtesting — did whale activity predict next-session returns?
- Delta/moneyness filter — test the ITM conviction hypothesis described above
Full code at github.com/staskh/trading_skills. Happy to answer questions about the implementation, the Modified Z-Score approach, or the broader methodology.
How to Built an Institutional Options Trades Detector was originally published in DataDrivenInvestor on Medium, where people are continuing the conversation by highlighting and responding to this story.