Global Markets Today: How Investors Can Track Indices, Futures, and Sector Trends
Global markets move every day because investors are constantly reacting to new information. Stock indices rise and fall, futures shift before the opening bell, commodities respond to supply and demand, bond yields influence risk appetite, and sector trends reveal where money is flowing. For investors, the challenge is not only to watch the market but to understand what the movement means.
The phrase global markets today is more than a search term. It represents the daily need to know what is happening across major indices, futures, sectors, currencies, commodities, and macro signals. A trader may use this information to plan short-term entries and exits. A long-term investor may use it to understand whether market conditions are supportive or risky. A research analyst may use it to prepare a daily note. A portfolio manager may use it to adjust exposure across sectors and asset classes.
Tracking global markets does not mean reacting to every small move. It means building a structured view of market direction. Investors need to know whether the broader market is risk-on or risk-off, whether leadership is broad or narrow, whether futures are confirming index strength, and whether sectors are rotating. When this information is organized properly, investors can make better decisions.
Why Global Market Tracking Matters
Global market tracking matters because financial markets are connected. A sharp move in U.S. indices can affect Asian and European markets. Rising bond yields can pressure growth stocks. A stronger dollar can influence commodities and emerging markets. A rally in crude oil can affect energy stocks, inflation expectations, and transportation companies. A sell-off in technology stocks can pull down major indices if tech carries a large weight.
Investors who look only at one stock may miss the bigger picture. A stock may appear weak not because the company is failing, but because the entire sector is under pressure. Another stock may rise not because its fundamentals changed, but because the market is moving into that sector. This is why indices, futures, and sector trends must be studied together.
Global market tracking helps investors understand context. It answers questions such as whether the market is supporting risk, whether large-cap stocks are leading, whether small caps are participating, whether commodities are confirming inflation pressure, and whether defensive sectors are attracting capital.
The better the context, the better the decision.
What Are Market Indices?
A market index is a basket of stocks that represents a segment of the market. Investors use indices to understand overall market direction. Instead of checking hundreds of individual stocks, they can look at an index to know whether a broad group of stocks is rising or falling.
Major global indices include the S&P 500, Nasdaq Composite, Dow Jones Industrial Average, Russell 2000, FTSE 100, DAX, CAC 40, Nikkei 225, Hang Seng, Nifty 50, Sensex, and many others. Each index represents a different market or group of companies.
The S&P 500 gives a broad view of large U.S. companies. The Nasdaq is heavily influenced by technology and growth stocks. The Dow Jones reflects major blue-chip companies. The Russell 2000 shows small-cap performance. In India, Nifty 50 and Sensex represent large listed companies. In Europe, indices like FTSE 100, DAX, and CAC 40 help investors track regional strength.
Indices are useful because they show market direction at a glance. If major indices are rising together, investor confidence may be strong. If only one index is rising while others are weak, leadership may be narrow.
Why Investors Should Track Multiple Indices
Tracking one index is useful, but tracking multiple indices gives a better picture. Different indices reveal different parts of the market.
For example, if the Nasdaq is rising strongly but the Russell 2000 is weak, it may show that large technology stocks are leading while smaller companies are struggling. If the Dow Jones is steady but growth stocks are falling, investors may be moving toward defensive or value-oriented companies. If European and Asian indices are weak while U.S. markets are strong, global participation may be uneven.
Multiple indices help investors identify whether the rally is broad or concentrated. A broad rally is usually healthier because many sectors and market segments participate. A narrow rally can still continue, but it may carry higher risk because leadership depends on a small group of stocks.
Investors should also compare domestic and global indices. A local market may be strong, but if global cues are weak, short-term volatility can rise. Similarly, a global rally can support local sentiment.
What Are Futures?
Futures are financial contracts that allow investors to trade the expected future price of an asset. In market tracking, futures are important because they often move before the regular stock market opens. They give early clues about investor sentiment.
Index futures such as S&P 500 futures, Nasdaq futures, Dow futures, and Russell 2000 futures are widely watched. Commodity futures such as crude oil, gold, silver, copper, and natural gas also influence market sentiment. Bond futures and interest rate futures can give signals about expectations for yields and monetary policy.
Pre-market futures are especially useful for traders. If futures are sharply higher before the market opens, it may suggest a positive opening. If futures are sharply lower, it may signal pressure. However, futures are not guarantees. The market can reverse after opening due to news, data, earnings, or institutional flows.
Futures should be used as a guide, not as a final prediction.
Why Futures Matter Before the Opening Bell
Before the cash market opens, investors want to know how the day may begin. Futures provide this early signal. They respond to overnight news, global market movement, economic data, geopolitical events, earnings reports, and central bank commentary.
For example, if U.S. futures rise after strong earnings from major technology companies, investors may expect growth stocks to open higher. If futures fall after inflation data, the market may prepare for a risk-off session. If crude oil futures rise sharply, energy stocks may attract attention, while sectors sensitive to fuel costs may face pressure.
Futures also help investors prepare, not panic. A trader can mark support and resistance levels before the opening. A long-term investor can avoid reacting emotionally to early volatility. A portfolio manager can plan hedging decisions if futures indicate weakness.
Still, futures should always be confirmed after the market opens. Opening gaps can fade, and early direction can change quickly.
Understanding Sector Trends
Sector trends show which parts of the market are gaining or losing strength. A stock market is made up of many sectors, such as technology, financials, healthcare, energy, consumer discretionary, consumer staples, industrials, utilities, materials, real estate, and communication services.
Sector tracking is important because money often rotates from one sector to another. When investors expect economic growth, they may prefer cyclical sectors such as industrials, financials, consumer discretionary, and technology. When investors expect uncertainty, they may move toward defensive sectors such as utilities, healthcare, and consumer staples.
Sector trends reveal market leadership. If technology and consumer discretionary stocks are leading, risk appetite may be strong. If utilities and staples are leading, investors may be becoming defensive. If energy is leading, oil prices or inflation expectations may be influencing the market.
A sector view helps investors understand what is driving index movement.
Sector Rotation and Market Cycles
Sector rotation happens when investors move capital from one sector to another based on economic expectations, valuation, interest rates, earnings trends, or market sentiment. This rotation can happen over weeks, months, or even years.
In early economic recovery phases, investors often favor sectors that benefit from improving demand. In expansion phases, growth and cyclical sectors may perform well. In late-cycle phases, energy, materials, and defensive sectors may attract attention. During slowdowns or recessions, investors may prefer stable cash-flow companies.
Sector rotation is not always perfect or predictable. However, tracking it helps investors identify changing market behavior. If banks, industrials, and small caps start outperforming after a long period of weakness, it may show improving economic confidence. If defensive sectors start leading while growth stocks fall, it may show caution.
A market dashboard that tracks sectors helps investors see these shifts clearly.
Market Breadth: The Health of the Market
Market breadth measures how many stocks are participating in a market move. It helps investors understand whether a rally is broad or narrow.
If a major index rises but only a few large stocks are responsible for the gain, market breadth may be weak. This can happen when mega-cap stocks dominate index performance. On the other hand, if many stocks across sectors are rising, breadth is strong. Strong breadth usually indicates healthier market participation.
Market breadth can be tracked through advancing and declining stocks, new highs and new lows, sector participation, equal-weighted indices, and small-cap performance.
Investors should not rely only on headline index levels. An index may look strong while many stocks are weak underneath. Breadth helps reveal what is happening below the surface.
Market Heatmaps and Visual Tracking
A market heatmap is a visual tool that shows stock or sector performance using colors and size blocks. It helps investors quickly identify strength and weakness across the market.
Large green blocks may show leading stocks or sectors. Red blocks may show areas under pressure. Heatmaps can be organized by sector, market capitalization, country, or asset class.
For investors, heatmaps are useful because they simplify complex data. Instead of reading long lists of price changes, investors can visually see where money is flowing. A heatmap may show whether technology is leading, banks are weak, energy is strong, or defensive sectors are gaining.
Market heatmaps are especially useful during volatile sessions because they show whether selling is broad-based or limited to a few areas.
Commodities and Global Market Direction
Commodities play an important role in global markets. Gold, crude oil, copper, silver, natural gas, and agricultural commodities can influence inflation, currencies, sector performance, and investor sentiment.
Gold is often watched as a safe-haven asset. When uncertainty rises, gold may attract demand. Crude oil affects energy companies, inflation expectations, transportation costs, and consumer spending. Copper is often seen as a signal of industrial demand because it is used in construction, manufacturing, and infrastructure. Silver has both industrial and precious metal characteristics.
Commodity trends can influence sector performance. Rising oil prices may support energy stocks but pressure airlines and logistics companies. Rising copper prices may suggest stronger industrial demand. Falling commodity prices may reduce inflation pressure but also signal weaker growth.
Investors who track global markets should include commodities in their daily review.
Bond Yields and Equity Markets
Bond yields are one of the most important signals for equity investors. When yields rise, the discount rate for future cash flows often rises. This can pressure growth stocks, especially companies valued heavily on future earnings. When yields fall, growth stocks may receive support because future cash flows become more attractive in present-value terms.
Bond yields also affect financial stocks, real estate, dividend stocks, and risk appetite. Banks may benefit from certain yield conditions, while rate-sensitive sectors may struggle when yields rise sharply.
Investors should watch major government bond yields, especially U.S. Treasury yields, because they influence global capital flows. Rising yields can make bonds more attractive compared with equities. Falling yields can support equity valuations if they reflect easing inflation and stable growth.
A complete market view includes both equities and bonds.
Currency Trends and Global Investors
Currencies influence global markets because they affect trade, corporate earnings, foreign investor flows, and commodity pricing. The U.S. dollar is especially important because many global assets are priced or influenced by it.
A strong dollar can pressure emerging markets because it may make dollar-denominated debt more expensive and reduce foreign capital flows. It can also affect commodities because many commodities are priced in dollars. A weak dollar may support commodities and emerging markets.
For multinational companies, currency movement can affect revenue and profit translation. Exporters and importers may also be affected differently depending on currency trends.
Investors tracking global markets should monitor currency movements along with indices and futures.
Risk-On vs Risk-Off Conditions
Market conditions are often described as risk-on or risk-off. In a risk-on environment, investors are more confident and willing to buy equities, growth stocks, small caps, high-yield bonds, and emerging market assets. In a risk-off environment, investors prefer safer assets such as government bonds, cash, defensive stocks, and sometimes gold.
Risk-on conditions may be visible through rising indices, strong small-cap participation, falling volatility, improving breadth, and leadership from cyclical sectors. Risk-off conditions may appear through falling equities, rising volatility, stronger defensive sectors, weaker commodities, and demand for safe-haven assets.
Understanding risk conditions helps investors adjust strategy. A trader may reduce aggressive positions during risk-off phases. A long-term investor may wait for better entry opportunities. A portfolio manager may rebalance exposure.
How Investors Can Build a Daily Market Routine
A daily market routine helps investors stay organized. Instead of randomly checking prices, investors can follow a structured process.
The first step is to check global indices. Look at how major U.S., European, and Asian indices performed. This gives a broad view of global sentiment.
The second step is to check futures. Index futures can show early expectations for the trading day. Commodity futures and bond futures can add macro context.
The third step is to review sector performance. Identify which sectors are leading and which are weak.
The fourth step is to check market breadth. A strong index with weak breadth deserves caution.
The fifth step is to monitor bond yields, currencies, and commodities. These assets often explain market behavior.
The sixth step is to connect the information. Do not look at each data point separately. Ask what the overall picture says about risk appetite, market leadership, and investor sentiment.
How Traders Use Global Market Data
Traders use global market data to plan short-term decisions. They watch futures before the open, identify key index levels, study sector strength, and track volume. If futures are strong and leading sectors confirm the move, traders may look for long setups. If futures are weak and breadth is poor, traders may reduce risk or look for short opportunities.
Traders also use global cues to avoid surprises. For example, if Asian markets sold off overnight and U.S. futures are weak, a trader may avoid aggressive buying at the open. If commodities are moving sharply, traders may focus on related sectors.
For traders, timing and discipline matter. Global market data helps create a plan before emotions take over.
How Long-Term Investors Use Global Market Data
Long-term investors use global market data differently from traders. They do not need to react to every intraday move. However, market tracking still helps them understand valuation, risk, sector rotation, and opportunity.
For example, if a broad market correction affects high-quality companies, long-term investors may prepare a buying list. If a sector becomes overheated, they may avoid fresh buying. If bond yields rise sharply, they may review growth stock valuations. If defensive sectors lead for many weeks, they may recognize increasing caution in the market.
Long-term investors can use global market trends to improve entry timing and portfolio balance. The goal is not daily trading. The goal is better awareness.
How Sector Trends Help Portfolio Allocation
Sector trends can guide portfolio allocation. If one sector becomes too dominant in a portfolio, risk increases. If market leadership shifts, investors may need to rebalance.
For example, a portfolio heavily concentrated in technology may perform well during growth-led rallies but struggle when yields rise or investors rotate into value sectors. A portfolio with exposure to financials, healthcare, energy, and consumer sectors may behave differently.
Tracking sector trends helps investors avoid overconcentration. It also helps them identify opportunities in sectors that are gaining strength.
A balanced investor should know not only which stocks they own but also which sectors drive their portfolio risk.
Common Mistakes Investors Make While Tracking Markets
One common mistake is focusing only on headline indices. An index may rise, but market breadth may be weak. Investors should check what is happening beneath the surface.
Another mistake is reacting emotionally to futures. Futures can change before and after the market opens. They should guide preparation, not create panic.
A third mistake is ignoring sector rotation. A stock may underperform because its sector is weak, not because the company has changed.
A fourth mistake is watching too many indicators without structure. Too much data can confuse investors. A clear routine is better.
A fifth mistake is treating global market trends as guaranteed predictions. Markets are uncertain. Data improves probability, but it does not remove risk.
Why a Market Dashboard Is Useful
A market dashboard helps investors organize information in one place. Instead of checking many websites and apps separately, investors can view indices, futures, sector trends, heatmaps, commodities, and market signals together.
This saves time and improves decision-making. A dashboard helps investors quickly answer important questions. Are global markets strong or weak? Which sectors are leading? Are futures confirming the trend? Are commodities supporting inflation concerns? Are bond yields pressuring equities?
A good market dashboard does not replace analysis. It supports analysis by presenting useful information clearly.
Conclusion
Tracking global markets today is not about reacting to every price movement. It is about understanding the larger market environment. Investors need to study indices, futures, sector trends, commodities, bond yields, currencies, breadth, and market sentiment together. Each signal adds context.
Indices show broad market direction. Futures provide early clues before the market opens. Sector trends reveal where money is moving. Market breadth shows whether participation is strong or weak. Commodities, bonds, and currencies explain the macro background. Together, these tools help investors make better decisions.
For traders, global market tracking supports timing, risk control, and daily planning. For long-term investors, it helps identify opportunities, avoid overpaying, and understand portfolio risk. For analysts and market watchers, it creates a structured view of the financial world.
The best investors do not rely on one signal. They connect multiple signals and build a disciplined market routine. In a fast-moving world, information is everywhere, but clarity is rare. A structured market view can help investors separate noise from useful insight.
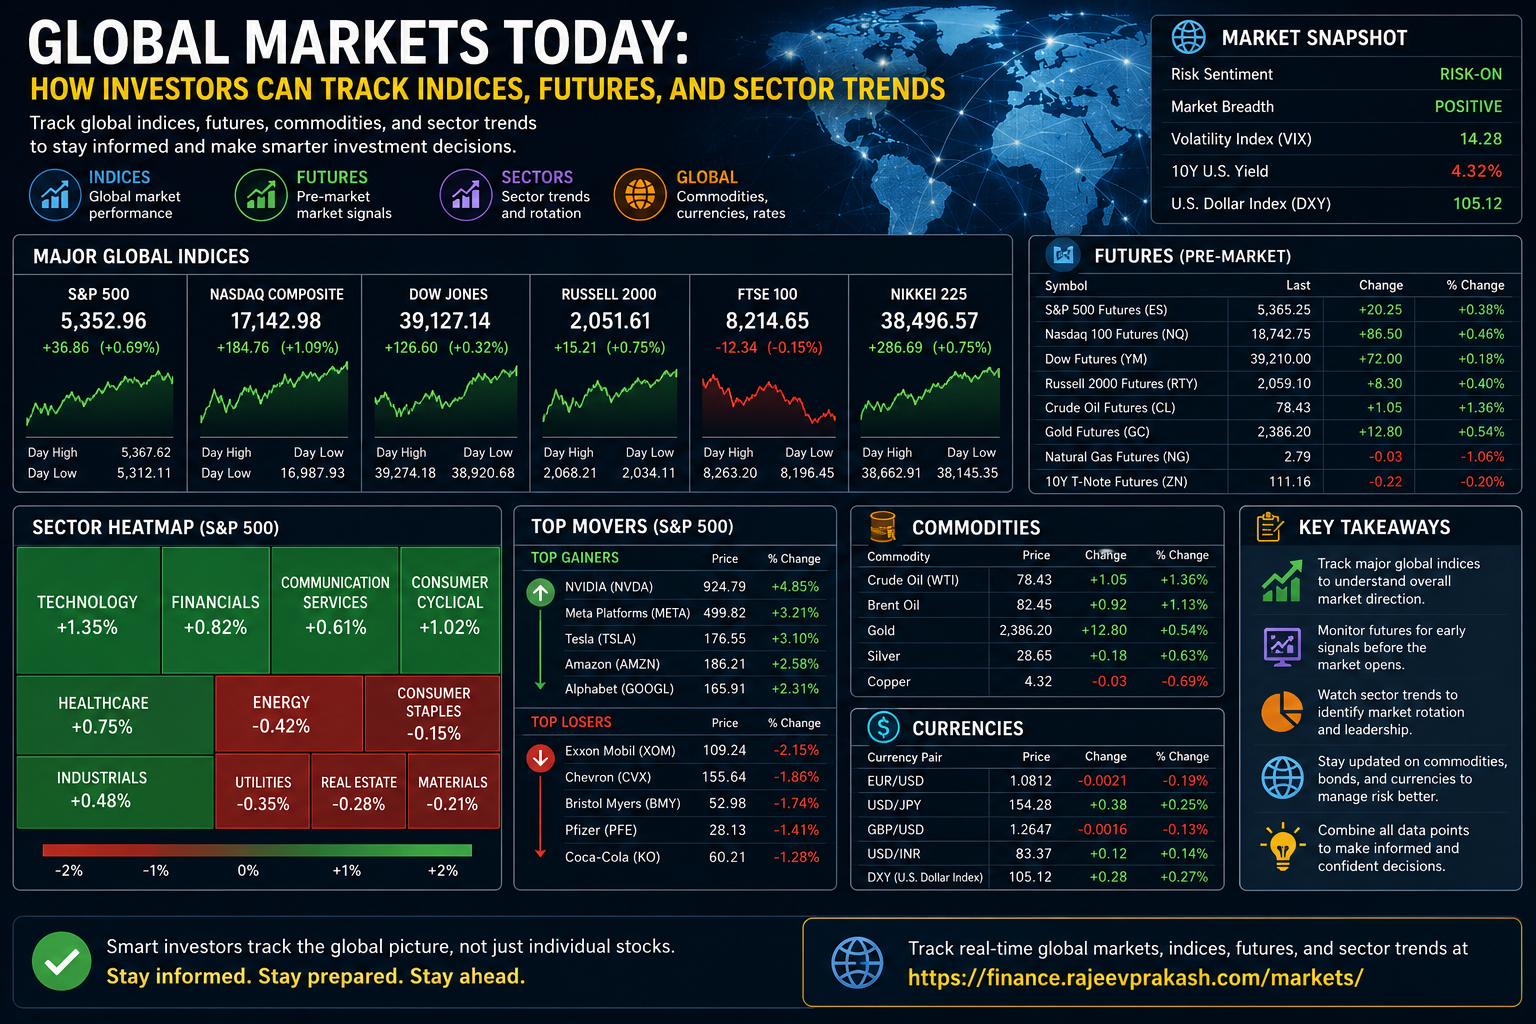
To track global indices, futures, sector trends, and broader market signals in one place, visit the Markets page here: https://finance.rajeevprakash.com/markets/