Building an Options IV and Greeks Database

Live options analytics change constantly. Implied volatility shifts, Greeks drift, and the shape of the surface can look different even a few minutes later. But a lot of teams still treat these numbers like something you glance at once. A screenshot in a deck. A one-off notebook cell. A quick check in a UI before a meeting.
That works until you need to answer basic questions that show up in real workflows:
- What did TSLA’s surface look like at 10:32?
- When did skew start steepening?
- Did the change come from the wings moving or the ATM shifting?
If you do not store the data as it arrives, you cannot replay it, compare it, or audit it. You are stuck with whatever you happened to look at in the moment.
In this walkthrough, we build something small but practical. An internal database that continuously captures SpiderRock MLink’s LiveImpliedQuote analytics for TSLA, stores each snapshot as queryable history, and also maintains a “latest view” table so you can pull the current surface state without scanning the full history.
The goal is not to build a trading system. It is to build a reliable internal dataset that you can monitor and query.
Note: SpiderRock MLink’s LiveImpliedQuote analytics is a product offered for a fee, which includes exchange charges for the underlying market data used in its creation.
What Data We’re Using?
This build is driven by one OptAnalytics message type from SpiderRock MLink: LiveImpliedQuote.

Each message represents an option contract and comes with the analytics you actually need for monitoring:
- the option identifier (symbol, expiry, strike, call or put)
- surface IV (sVol) and related surface fields
- Greeks (delta, gamma, theta, vega)
- context fields like underlying price (uPrc), time to expiry (years), and rate (rate)
- timestamps and calc source markers, which matter when you’re turning a live feed into a database
We’ll treat sVol as the main volatility field for the article and refer to it as surface IV. That keeps the workflow consistent when we rebuild smiles or compute skew proxies from stored history.
The demo uses TSLA because it has a rich and active options chain, which makes the database and queries more interesting even in a short capture window. The same pipeline works for any other underlying; the only thing you change is the symbol filter.
Setup: Importing Packages
Before touching the database or the API, we set up a small, repeatable environment. This section is intentionally minimal. We only import what we need for three things: making REST calls, storing data in SQLite, and doing basic analysis and plots.
import requests
import sqlite3
import pandas as pd
import numpy as np
import time
from datetime import datetime, timezone
import matplotlib.pyplot as plt
plt.style.use('ggplot')
- requests is used for calling MLink REST endpoints.
- sqlite3 gives us a lightweight database we can write to locally without extra setup.
- pandas and numpy are only for shaping and filtering the data once it comes back.
- time and datetime help us run a polling loop and timestamp each snapshot so the database becomes a real-time series.
Database Design
If the goal is to make live analytics queryable, the database design has to support two different needs.
First, you want an audit trail. Every snapshot should be preserved so you can reconstruct what the surface looked like at a specific time.
Second, you also want a fast way to answer “what does it look like right now” without scanning everything you’ve ever stored.
So we use two tables:
- implied_quote_history. Append-only. Every poll inserts a full snapshot.
- implied_quote_latest. One row per option contract. Each poll upserts into this table so it always reflects the most recent snapshot.
The core of both tables is a stable option identifier. In the feed, the option key is nested, so we normalize it into a single option_key string that includes symbol, expiry, strike, call or put, and venue fields. This becomes the primary key for the latest table and the main join key for queries.
#config
api_key = "YOUR SPIDERROCK API KEY"
mlink_url = "https://mlink-live.nms.saturn.spiderrockconnect.com/rest/json"

msg_type = "LiveImpliedQuote"

symbol = "TSLA"
poll_interval_s = 10
poll_duration_s = 120
limit = 2000

#create db connection
db_path = "/mnt/data/optanalytics_iv_greeks.db"

def get_conn(path: str = db_path):
    conn = sqlite3.connect(path)
    conn.execute("PRAGMA journal_mode=WAL;")
    conn.execute("PRAGMA synchronous=NORMAL;")
    return conn

#create db schema
def setup_db(path: str = db_path):
    conn = get_conn(path)
    cur = conn.cursor()

    cur.execute("""
    create table if not exists implied_quote_history (
        id integer primary key autoincrement,
        asof_ts text not null,

        option_key text not null,
        symbol text not null,
        expiry text not null,
        strike real not null,
        cp text not null,

        calc_source text,
        u_prc real,
        years real,
        rate real,

        s_vol real,
        atm_vol real,
        s_mark real,

        o_bid real,
        o_ask real,
        o_bid_iv real,
        o_ask_iv real,

        delta real,
        gamma real,
        theta real,
        vega real,

        src_ts text
    );
    """)

    cur.execute("""
    create index if not exists idx_hist_symbol_expiry_asof
    on implied_quote_history(symbol, expiry, asof_ts);
    """)

    cur.execute("""
    create index if not exists idx_hist_option_asof
    on implied_quote_history(option_key, asof_ts);
    """)

    cur.execute("""
    create table if not exists implied_quote_latest (
        option_key text primary key,

        last_asof_ts text not null,
        symbol text not null,
        expiry text not null,
        strike real not null,
        cp text not null,

        calc_source text,
        u_prc real,
        years real,
        rate real,

        s_vol real,
        atm_vol real,
        s_mark real,

        o_bid real,
        o_ask real,
        o_bid_iv real,
        o_ask_iv real,

        delta real,
        gamma real,
        theta real,
        vega real,

        src_ts text
    );
    """)

    cur.execute("""
    create index if not exists idx_latest_symbol_expiry
    on implied_quote_latest(symbol, expiry);
    """)

    conn.commit()
    conn.close()

setup_db()
This creates the SQLite database file and both tables. The history table is append-only and indexed for the two queries we’ll run later: pulling snapshots by expiry and time, and pulling a specific option’s timeline by option_key. The latest table is keyed by option_key, which lets us upsert and maintain a consistent “current view.”
The columns we store are intentionally opinionated. We keep surface IV (s_vol), surface mark (s_mark), Greeks, and a few context fields. We also store timestamps so later we can reason about when a value was produced.
Pulling LiveImpliedQuote
Now we do the first live pull. The goal here is not to build a perfect filter. It’s to confirm that we can retrieve a meaningful slice of TSLA option analytics and that the response structure is what we expect.
We request LiveImpliedQuote and filter by symbol using the where clause. The response is a list where most rows are actual LiveImpliedQuote messages, and one row at the end is a QueryResult summary.
def fetch_live_implied_quote(symbol: str, limit: int = 2000):
    where = f"okey.tk:eq:{symbol}"

    params = {
        "apiKey": api_key,
        "cmd": "getmsgs",
        "msgType": msg_type,
        "where": where,
        "limit": limit
    }

    r = requests.get(mlink_url, params=params)
    r.raise_for_status()
    return r.json()

raw = fetch_live_implied_quote(symbol, limit=limit)
print("raw messages:", len(raw))
print("first type:", raw[0].get("header", {}).get("mTyp") if raw else None)
This is a straight REST getmsgs call. We pass the API key, message type, and a simple symbol filter. The limit is important. It caps how many messages we get back in one poll, so for active underlyings, the returned set of strikes and expiries can vary between polls. That’s fine for this tutorial, because the goal is to show the database pattern and the types of monitoring queries it enables.
This is the output you should see:

Normalizing the Response Into Rows
Right now, raw is a list of nested message objects. That format is fine for transport, but it’s not something you can store or query directly. So now, we turn each LiveImpliedQuote message into one flat row with a consistent schema.
def make_option_key(okey: dict) -> str:
    return "|".join([
        str(okey.get("tk")),
        str(okey.get("dt")),
        str(okey.get("xx")),
        str(okey.get("cp")),
        str(okey.get("at")),
        str(okey.get("ts")),
    ])

def normalize_liq(raw: list, asof_ts: str, keep_calc_source: str = "Loop") -> pd.DataFrame:
    rows = []

    for row in raw:
        if row.get("header", {}).get("mTyp") != "LiveImpliedQuote":
            continue

        m = row.get("message", {})
        if keep_calc_source and m.get("calcSource") != keep_calc_source:
            continue

        pkey = m.get("pkey", {})
        okey = pkey.get("okey", {})
        if not okey:
            continue

        s_vol = m.get("sVol")
        if s_vol is None or s_vol == 0:
            continue

        o_bid = m.get("oBid", 0) or 0
        o_ask = m.get("oAsk", 0) or 0

        quote_ok = int(not (o_bid == 0 and o_ask == 0))

        rows.append({
            "asof_ts": asof_ts,
            "option_key": make_option_key(okey),

            "symbol": okey.get("tk"),
            "expiry": okey.get("dt"),
            "strike": okey.get("xx"),
            "cp": okey.get("cp"),

            "calc_source": m.get("calcSource"),
            "u_prc": m.get("uPrc"),
            "years": m.get("years"),
            "rate": m.get("rate"),

            "s_vol": s_vol,
            "atm_vol": m.get("atmVol"),
            "s_mark": m.get("sMark"),

            "o_bid": o_bid,
            "o_ask": o_ask,
            "o_bid_iv": m.get("oBidIv"),
            "o_ask_iv": m.get("oAskIv"),
            "quote_ok": quote_ok,

            "delta": m.get("de"),
            "gamma": m.get("ga"),
            "theta": m.get("th"),
            "vega": m.get("ve"),

            "src_ts": m.get("timestamp"),
        })

    df = pd.DataFrame(rows)
    if df.empty:
        return df

    df = (
        df.sort_values("src_ts")
          .drop_duplicates(subset=["option_key"], keep="last")
          .reset_index(drop=True)
    )
    return df

asof_ts = datetime.now(timezone.utc).isoformat(timespec="seconds").replace("+00:00", "Z")
snapshot_df = normalize_liq(raw, asof_ts)

print("snapshot rows:", len(snapshot_df))
print("quote_ok distribution:", snapshot_df["quote_ok"].value_counts().to_dict() if not snapshot_df.empty else {})
snapshot_df.head()
There are three practical decisions baked into this normalization step:
- First, we build a stable option_key from the option identifier so we have a consistent primary key for the latest table.
- Second, we keep only calcSource="Loop". LiveImpliedQuote can include both Tick and Loop records. Loop records tend to be more consistent for snapshot-style analysis because the underlying reference price is stable across the surface.
- Third, we avoid aggressive filtering. In this dataset, the top-of-book bid and ask fields can be zero even when the analytics fields are populated. So instead of dropping those rows, we store a quote_ok flag and keep the record. That keeps the pipeline usable while still making it obvious later which rows had live quotes.
This is the output:

At this point, one row represents one option contract snapshot. The fact that quote_ok is 0 across the board simply means bid and ask are not populated in this slice, even though surface IV, Greeks, and other analytics fields are present. That is still useful for building a monitoring database, because the core idea here is tracking the evolution of analytics over time, not reconstructing executable markets.
Writing To The Database
Now that we have a clean snapshot DataFrame, the job is to persist it in two places.
- History table: Append everything. This is the audit log.
- Latest table: Upsert by option_key. This is the fast “current view.”
This separation is what makes the database useful. History lets you reconstruct any past snapshot. Latest lets you answer “what does the surface look like right now” without scanning time series.
def safe_add_column(table: str, col: str, col_type: str, path: str = db_path):
    conn = get_conn(path)
    cur = conn.cursor()
    existing = [r[1] for r in cur.execute(f"PRAGMA table_info({table});").fetchall()]
    if col not in existing:
        cur.execute(f"ALTER TABLE {table} ADD COLUMN {col} {col_type};")
    conn.commit()
    conn.close()

safe_add_column("implied_quote_history", "quote_ok", "INTEGER")
safe_add_column("implied_quote_latest", "quote_ok", "INTEGER")

def write_snapshot_to_db(df: pd.DataFrame, path: str = db_path) -> tuple[int, int]:
    if df.empty:
        return 0, 0

    conn = get_conn(path)
    cur = conn.cursor()

    cols = [
        "asof_ts",
        "option_key","symbol","expiry","strike","cp",
        "calc_source","u_prc","years","rate",
        "s_vol","atm_vol","s_mark",
        "o_bid","o_ask","o_bid_iv","o_ask_iv",
        "delta","gamma","theta","vega",
        "quote_ok","src_ts"
    ]

    for c in cols:
        if c not in df.columns:
            df[c] = None

    insert_df = df[cols].copy()

    cur.executemany(
        """
        insert into implied_quote_history (
            asof_ts,
            option_key, symbol, expiry, strike, cp,
            calc_source, u_prc, years, rate,
            s_vol, atm_vol, s_mark,
            o_bid, o_ask, o_bid_iv, o_ask_iv,
            delta, gamma, theta, vega,
            quote_ok, src_ts
        ) values (?, ?, ?, ?, ?, ?, ?, ?, ?, ?, ?, ?, ?, ?, ?, ?, ?, ?, ?, ?, ?, ?, ?)
        """,
        insert_df.itertuples(index=False, name=None)
    )
    history_inserted = cur.rowcount

    cur.executemany(
        """
        insert into implied_quote_latest (
            option_key,
            last_asof_ts, symbol, expiry, strike, cp,
            calc_source, u_prc, years, rate,
            s_vol, atm_vol, s_mark,
            o_bid, o_ask, o_bid_iv, o_ask_iv,
            delta, gamma, theta, vega,
            quote_ok, src_ts
        ) values (?, ?, ?, ?, ?, ?, ?, ?, ?, ?, ?, ?, ?, ?, ?, ?, ?, ?, ?, ?, ?, ?, ?)
        on conflict(option_key) do update set
            last_asof_ts=excluded.last_asof_ts,
            symbol=excluded.symbol,
            expiry=excluded.expiry,
            strike=excluded.strike,
            cp=excluded.cp,
            calc_source=excluded.calc_source,
            u_prc=excluded.u_prc,
            years=excluded.years,
            rate=excluded.rate,
            s_vol=excluded.s_vol,
            atm_vol=excluded.atm_vol,
            s_mark=excluded.s_mark,
            o_bid=excluded.o_bid,
            o_ask=excluded.o_ask,
            o_bid_iv=excluded.o_bid_iv,
            o_ask_iv=excluded.o_ask_iv,
            delta=excluded.delta,
            gamma=excluded.gamma,
            theta=excluded.theta,
            vega=excluded.vega,
            quote_ok=excluded.quote_ok,
            src_ts=excluded.src_ts
        """,
        insert_df[[
            "option_key","asof_ts","symbol","expiry","strike","cp",
            "calc_source","u_prc","years","rate",
            "s_vol","atm_vol","s_mark",
            "o_bid","o_ask","o_bid_iv","o_ask_iv",
            "delta","gamma","theta","vega",
            "quote_ok","src_ts"
        ]].itertuples(index=False, name=None)
    )
    latest_upserted = cur.rowcount

    conn.commit()
    conn.close()
    return history_inserted, latest_upserted

hist_n, latest_n = write_snapshot_to_db(snapshot_df)
print("history inserted:", hist_n)
print("latest upserted:", latest_n)
We batch write using executemany so inserts are fast even with thousands of option rows. The history insert is straightforward. The latest write uses a SQLite upsert keyed on option_key, which means if the contract already exists in the latest table, its fields are overwritten with the newest snapshot.
You should see:

After the first write, both tables have the same number of rows. That’s expected, because there is only one snapshot in history so far. Once we start polling multiple snapshots, the history table will grow every cycle, while the latest table will stay roughly flat and continue updating in place.
Running a Short Polling Capture
At this point, the pipeline works end-to-end for a single snapshot. The whole point of the database, though, is to turn live analytics into a time series. So we run a short capture window and store multiple snapshots back-to-back.
This is not meant to be a production scheduler. It is just a simple loop that runs for a couple of minutes, polls every few seconds, timestamps the snapshot, and writes it to both tables.
def poll_and_write(symbol: str, duration_s: int = poll_duration_s, interval_s: int = poll_interval_s):
    start = time.time()
    polls = 0
    total_hist = 0

    while time.time() - start < duration_s:
        asof_ts = datetime.now(timezone.utc).isoformat(timespec="seconds").replace("+00:00", "Z")

        raw = fetch_live_implied_quote(symbol, limit=limit)
        df = normalize_liq(raw, asof_ts)

        hist_n, latest_n = write_snapshot_to_db(df)
        polls += 1
        total_hist += hist_n

        print(f"[{polls}] {asof_ts} snapshot_rows={len(df)} history+={hist_n} latest_upsert={latest_n}")
        time.sleep(interval_s)

    print(f"done. polls={polls}, total_history_added={total_hist}")

poll_and_write(symbol, duration_s=120, interval_s=10)
Each loop iteration represents one snapshot. We generate a UTC timestamp (asof_ts), pull the latest batch from LiveImpliedQuote, normalize it into rows, then write it into the database. The history table accumulates every snapshot. The latest table overwrites by option_key, so it always represents the most recent view.
One practical detail is worth calling out. The API call is capped by limit, so you are not guaranteed to receive an identical set of strikes and expiries every poll. That is why snapshot_rows can vary between iterations. In production, you usually stabilize the slice by pinning specific expiries and a strike band or by interpolating IV to fixed moneyness points. For this tutorial, we keep ingestion simple and focus on the database pattern and the monitoring queries it enables.
You should see per-poll telemetry like this:
[1] 2026-04-14T18:09:29Z snapshot_rows=1454 history+=1454 latest_upsert=1454
...
done. polls=9, total_history_added=12806
This confirms the database is building a time series. Over nine polls, you stored 12,806 option rows in history. The latest table is updated each time, but it does not grow in the same way as history because it overwrites per contract key.
From the next section, we’ll stop writing and start querying.
Analysis: Smile Reconstruction From the Database
Once the data is in implied_quote_history, the workflow flips. We stop thinking in terms of “API responses” and start thinking in terms of “queries.” This section does two things. First, it picks an expiry that has enough rows to be representative. Then it reconstructs the call-side volatility smile for that expiry across a few timestamps.
Pick an Expiry with Good Coverage
If you pick an expiry that only appears sporadically in the captured snapshots, the smile plot will be misleading. So we start by looking at which expiries have the most rows in the history table.
conn = get_conn()

expiry_counts = pd.read_sql_query(
    """
    select expiry, count(*) as n
    from implied_quote_history
    where symbol = ?
    group by expiry
    order by n desc
    limit 10
    """,
    conn,
    params=(symbol,)
)

conn.close()
expiry_counts
This query scans only the history table, filters to TSLA, and counts how many option rows exist per expiry across the capture window. We keep the top 10 and pick the first one as the expiry we’ll reconstruct.

The expiry date 2026-11-20 has the highest count.
Here, the count does not mean this expiry is “best” in any trading sense. It just means it showed up most consistently in the captured data. That makes it a practical choice for a clean smile comparison.
Rebuild the Smile Across Snapshots
Now we query the stored history for one expiry, keep only calls, and plot surface IV (s_vol) against strike for multiple snapshot timestamps.
chosen_expiry = "2026-11-20"

conn = get_conn()
smile = pd.read_sql_query(
    """
    select asof_ts, strike, cp, s_vol, u_prc
    from implied_quote_history
    where symbol = ? and expiry = ?
    """,
    conn,
    params=(symbol, chosen_expiry)
)
conn.close()

smile_calls = smile[smile["cp"] == "Call"].copy()

ts_list = sorted(smile_calls["asof_ts"].unique())
pick = [ts_list[0], ts_list[len(ts_list)//2], ts_list[-1]]

plt.figure(figsize=(9,5))
for ts in pick:
    g = smile_calls[smile_calls["asof_ts"] == ts].sort_values("strike")
    plt.plot(g["strike"], g["s_vol"], label=ts)

plt.title(f"{symbol} Vol Smile (Calls) | Expiry {chosen_expiry} | 3 snapshots")
plt.xlabel("Strike")
plt.ylabel("Implied Vol (s_vol)")
plt.grid(True)
plt.legend()
plt.show()
We pull all rows for the chosen expiry from history, then filter to calls so we don’t mix put and call shapes. To keep the plot readable, we only plot three snapshots. First, middle, and last.

Over a short capture window, the smiles often overlap heavily. That does not mean the system is not working. It usually means the surface did not move much in those two minutes. The important part is that we can reconstruct and compare it purely from stored history.
Zoom-In Around Spot
The full-range plot is useful for shape, but it can hide small shifts near the region people actually care about. So we zoom to a band around the underlying price.
s0 = float(smile_calls["u_prc"].dropna().median())
low, high = s0 * 0.6, s0 * 1.4

for ts in pick:
    g = smile_calls[smile_calls["asof_ts"] == ts].sort_values("strike")
    g = g[(g["strike"] >= low) & (g["strike"] <= high)]
    plt.plot(g["strike"], g["s_vol"], label=ts)

plt.title(f"{symbol} Vol Smile (Calls) | Expiry {chosen_expiry} | zoomed")
plt.xlabel("Strike")
plt.ylabel("Implied Vol (s_vol)")
plt.grid(True)
plt.legend(fontsize=8)
plt.show()
We take a robust spot proxy from the stored u_prc values and then keep strikes within a range around it. The goal is not precision. It is to make the chart readable and show whether the near-ATM region is drifting.
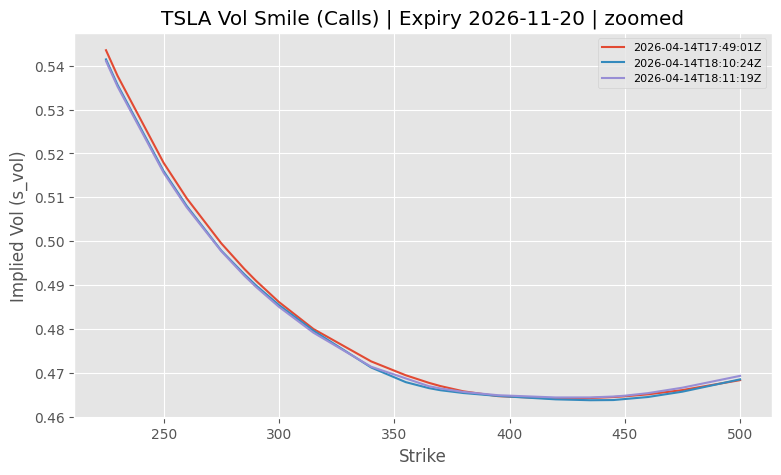
Here, even small changes become visible. This is also why storing history matters. If you only looked at one snapshot in isolation, these shifts would be easy to miss or dismiss.
Analysis: ATM IV and Skew Over Time
A full smile plot is useful, but it is not always the fastest way to monitor a surface. In practice, teams usually track a few summary numbers per expiry so they can spot changes quickly, then drill down only when something looks off.
Here we reduce each stored snapshot into two metrics for a single expiry.
- ATM IV: Surface IV at the strike closest to spot.
- Skew proxy: Surface IV at 0.9 times spot minus surface IV at 1.1 times spot, using the closest available strikes.
chosen_expiry = "2026-11-20"

conn = get_conn()
df = pd.read_sql_query(
    """
    select asof_ts, strike, s_vol, u_prc
    from implied_quote_history
    where symbol = ? and expiry = ? and cp = 'Call'
    """,
    conn,
    params=(symbol, chosen_expiry)
)
conn.close()

df["strike"] = df["strike"].astype(float)
df["s_vol"] = df["s_vol"].astype(float)

def closest_iv(grp: pd.DataFrame, target_strike: float):
    g = grp.iloc[(grp["strike"] - target_strike).abs().argsort()[:1]]
    return float(g["s_vol"].iloc[0]), float(g["strike"].iloc[0])

rows = []
for ts, grp in df.groupby("asof_ts"):
    spot = float(grp["u_prc"].dropna().median())
    atm_target = spot
    down_target = spot * 0.9
    up_target = spot * 1.1

    atm_iv, atm_k = closest_iv(grp, atm_target)
    down_iv, down_k = closest_iv(grp, down_target)
    up_iv, up_k = closest_iv(grp, up_target)

    rows.append({
        "asof_ts": ts,
        "spot": spot,
        "atm_strike": atm_k,
        "atm_iv": atm_iv,
        "k90": down_k,
        "iv_90": down_iv,
        "k110": up_k,
        "iv_110": up_iv,
        "skew_90_110": down_iv - up_iv
    })

metrics = pd.DataFrame(rows).sort_values("asof_ts").reset_index(drop=True)
metrics
We query the history table for one expiry and keep only calls, then group by snapshot timestamp. For each snapshot, we use the median u_prc as a spot proxy and pick the closest available strike to spot. That gives ATM IV. We repeat the same approach for 0.9 times spot and 1.1 times spot and compute a skew proxy as the difference.
The table also stores the actual strikes used (atm_strike, k90, k110). Options strikes are discrete, so the nearest strike can change between snapshots. Keeping the chosen strikes visible makes the metric explainable when it moves.
The output is a table with one row per snapshot timestamp and the computed metrics:

Now that we have a clean time series table, we can visualize the two metrics. First, ATM IV. Then, the skew proxy.
plt.plot(metrics["asof_ts"], metrics["atm_iv"])
plt.title(f"{symbol} ATM IV over time | Expiry {chosen_expiry}")
plt.xticks(rotation=30, ha="right")
plt.ylabel("ATM IV (s_vol)")
plt.grid(True)
plt.show()

plt.plot(metrics["asof_ts"], metrics["skew_90_110"])
plt.title(f"{symbol} Skew proxy ([email protected] - [email protected]) | Expiry {chosen_expiry}")
plt.xticks(rotation=30, ha="right")
plt.ylabel("Skew proxy")
plt.grid(True)
plt.show()
Here is the first chart, ATM IV over time:

ATM IV tends to move slowly over short windows unless there is a sharp repricing event. In this run, it stays fairly stable, which is a realistic outcome for a short capture. The value here is that the database turns “fairly stable” into something you can quantify and compare later, rather than a vague impression.
Here is the second chart, Skew proxy over time:

The skew proxy is more sensitive because it is based on wing points. If it changes, it usually means the downside is being repriced differently from the upside for that expiry. One nuance is that the nearest available strike can change between snapshots, which can create step-like moves even when the surface is not moving dramatically. That is why we keep k90 and k110 in the metrics table. It keeps the skew plot explainable.
Alert-Style Thresholds
Once you have a metrics table per snapshot, adding a monitoring layer is straightforward. The idea is not to generate trades. It is to flag when the surface moves enough that someone should look closer.
Here we do two checks:
- ATM IV change alert: Flag if ATM IV changes more than a small threshold between snapshots.
- Skew change alert: Flag if the skew proxy changes more than a threshold between snapshots.
alerts = metrics.copy()

alerts["atm_iv_change"] = alerts["atm_iv"].diff()
alerts["skew_change"] = alerts["skew_90_110"].diff()

atm_thresh = 0.002
skew_thresh = 0.003

alerts["atm_alert"] = alerts["atm_iv_change"].abs() >= atm_thresh
alerts["skew_alert"] = alerts["skew_change"].abs() >= skew_thresh

alerts[[
    "asof_ts",
    "atm_iv", "atm_iv_change", "atm_alert",
    "skew_90_110", "skew_change", "skew_alert",
    "atm_strike", "k90", "k110"
]]
We take the per-snapshot metrics table and compute first differences. Then we compare those changes to thresholds and store boolean flags. The output table keeps both the metrics and the strikes used for the calculations, so any alert is explainable rather than a black box.

In this run, the ATM IV alerts are all false, while the skew alert triggers once.
The skew alert fires because the skew proxy jumps by more than the threshold between two snapshots. This is explainable. If you see the table, you can see the strikes used for the proxy changed around the same time (k90 shifts from 340 to 315). Because strikes are discrete, nearest-strike metrics can step even when the surface is not moving dramatically.
To make this easier to read, we also plot the two series and mark alert points.
plt.plot(alerts["asof_ts"], alerts["atm_iv"])
for i, r in alerts[alerts["atm_alert"]].iterrows():
    plt.scatter(r["asof_ts"], r["atm_iv"],  s=30, edgecolors="r", alpha=0.6, linewidth=2)
plt.title(f"{symbol} ATM IV with alerts | Expiry {chosen_expiry}")
plt.xticks(rotation=30, ha="right")
plt.grid(True)
plt.show()

plt.plot(alerts["asof_ts"], alerts["skew_90_110"])
for i, r in alerts[alerts["skew_alert"]].iterrows():
    plt.scatter(r["asof_ts"], r["skew_90_110"], s=30, edgecolors="r", alpha=0.6, linewidth=2)
plt.title(f"{symbol} Skew proxy with alerts | Expiry {chosen_expiry}")
plt.xticks(rotation=30, ha="right")
plt.grid(True)
plt.show()
Both plots use the same pattern. Plot the metric as a line, then overlay a marker on any timestamp where the corresponding alert flag is true. This makes it obvious when something crossed the threshold.
This chart represents skew proxy with alerts:

This chart shows one alert marker, which matches what we saw in the table.
The ATM IV plot is not featured since there are no alert points.
Wrapping Up
In this walkthrough, we used SpiderRock MLink’s LiveImpliedQuote feed for TSLA and turned it into a small internal database you can query. We stored every snapshot in an append-only history table, maintained a latest view keyed by a stable option identifier, then used that stored data to rebuild a smile, track ATM surface IV and a simple skew proxy, and add a basic alert rule on top.
This fits well in B2B workflows because it turns live analytics into something operational. A dataset you can audit, replay, and monitor. The same pattern works whether you are building an internal dashboard, running routine surface checks for a desk, or doing a quick post-event review without relying on screenshots and one-off notebook runs.
If you want to extend it, the most practical next steps are longer capture windows, tracking multiple symbols, and moving from SQLite to Postgres once the data volume grows. If metric stability becomes important, you can also standardize the slice you track per poll or interpolate IV to fixed moneyness points so skew measures do not step when nearest strikes change.
With that being said, you’ve reached the end of the article. Hope you learned something new and useful.
From Live Options Analytics to a Queryable Database in Python was originally published in DataDrivenInvestor on Medium, where people are continuing the conversation by highlighting and responding to this story.