

 Written by Biraajmaan Tamuly, Staff Writer. Reviewed by Ray Salmond, Staff Editor. Written by Biraajmaan Tamuly, Staff Writer. Reviewed by Ray Salmond, Staff Editor.
 Ether triple top strikes at $2.4K as ETH analysts doubt bullish trend change
Market AnalysisPublishedApr 27, 2026Ether charts flash an ominous triple-top pattern as ETH fails to overcome $2,400. Will bears maintain control over the altcoin’s price action?

Ether (ETH) fell 3.4% to $2,287 on Monday, after its fourth rejection at the $2,400 level since April 14. The price continues to trade below the 100-day moving average, with over $2.5 billion in liquidation risk concentrated near the $2,150 support zone.
Crypto analyst Michaël van de Poppe also flagged weakness in Ether relative to Bitcoin, raising doubts about the strength of any near-term uptrend.
Repeat rejections at $2,400 cap ETH's upside
Ether has failed to break $2,400 four times over the past two weeks, forming a clear triple top pattern on the daily chart. Each retest saw a loss of strength near that level, suggesting supply absorption by sellers.
The 100-day exponential moving average (EMA) near $2,350 continues to act as a dynamic resistance. The price has not held above it on the one-day chart, keeping upside attempts short-lived.
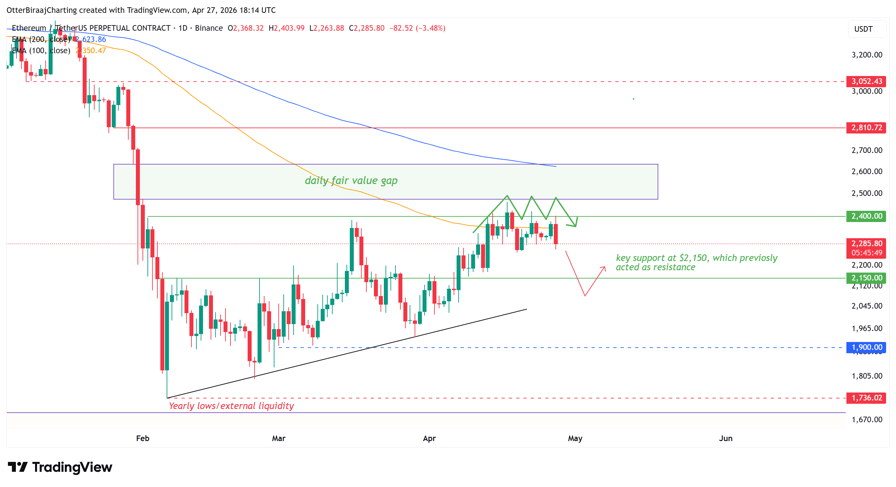
ETH/USDT on the one-day chart. Source: Cointelegraph/TradingView
The support at $2,150 now carries more weight. The level previously acted as resistance and could be tested as a base in the coming days. A move below it opens the door to deeper downside levels.
Liquidation data adds pressure to this zone, with $2.5 billion in leveraged longs sitting below $2,150. A break below this level could trigger forced selling into the $2,050 to $1,900 range.
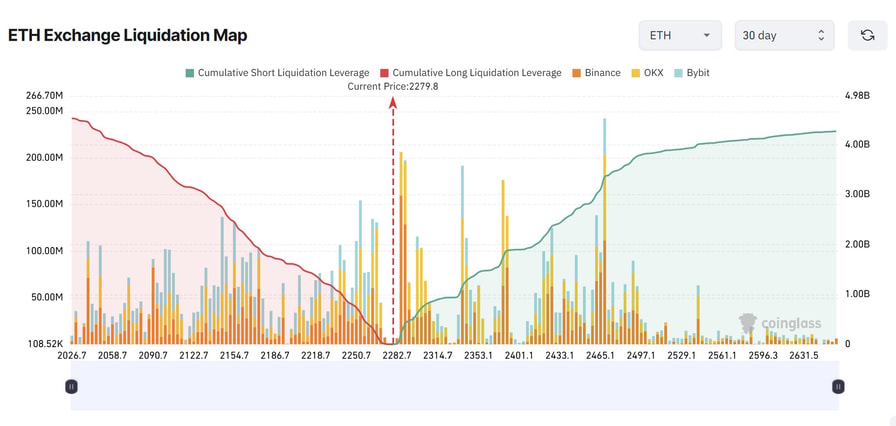
Ether liquidation map. Source: CoinGlass
MN Capital founder Michaël van de Poppe noted weakness in the ETH/BTC pair. The ratio dropped below 0.032 BTC, removing a key support level tied to prior continuation attempts.
The ETH/BTC ratio also slipped under the 21-period moving average, signaling fading relative strength against Bitcoin. The next higher-time frame level sits near 0.026 BTC, where buyers previously stepped in.
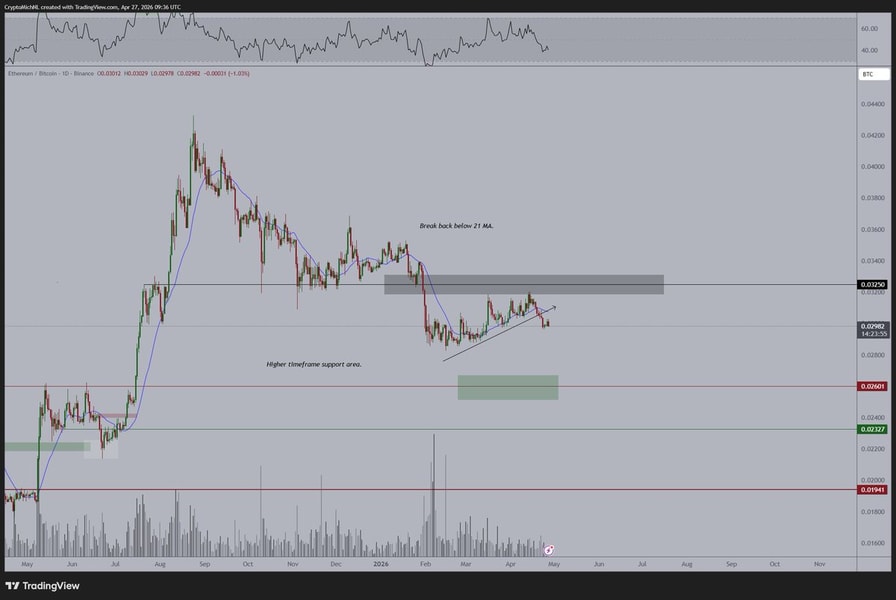
ETH/BTC chart analysis on Binance. Source: CryptoQuant
Related: BitMine acquires 101,000 ETH despite $6.5B in unrealized losses
ETH futures positions hint at a market reset
On Binance, Ether’s open interest (OI) has dropped to $2.58 billion, matching levels seen when ETH traded near $2,200 earlier this month. The decline points to a reset in leverage following the recent positioning buildup.
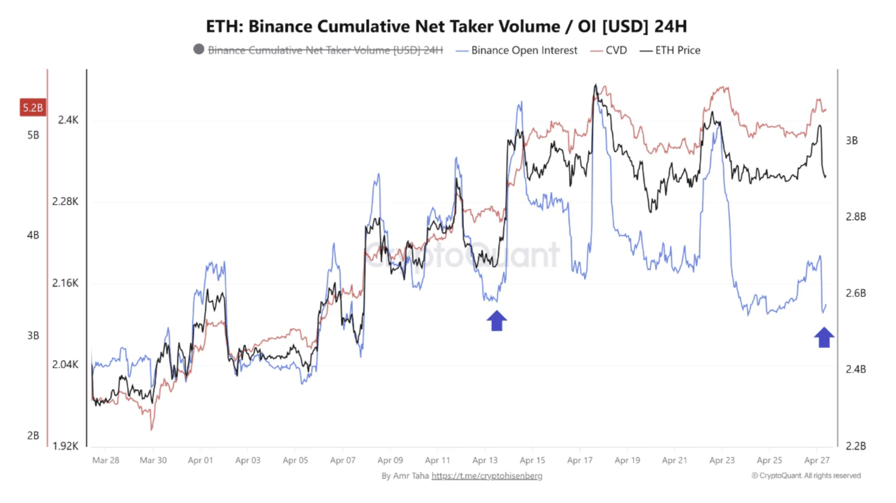
ETH: Binance cumulative net taker volume. Source: CryptoQuant
The funding rate offers a clearer signal, sitting near -0.013%, the lowest reading since February. The short positions dominate new activity while earlier long exposure has been reduced.
Crypto analyst Amr Taha noted that this combination places ETH in a shorts-heavy setup with lower leverage. If price holds near current levels, the imbalance between positioning and price could tighten, leading to a breakout sooner than later.
The key zone centers on $2,150, where liquidation risks and the current technical level converge on the daily chart.
Related: ETH price up 10% in April, so why is Ethereum Foundation selling?

