Your codebase is rotting. Your velocity is dropping. Your stakeholders think you’re just slow. Here’s how to make invisible work visible.

Part 7 of my series on Technical Communication. Last time, we explored writing technical documents that non-technical people actually read. This time, we focus on the hardest part: making invisible work visible and getting non-technical stakeholders to fund the fix.
The Velocity Death Spiral
This is a pattern I saw at a fintech company in 2024. In Q1 the team could ship a new API endpoint in three days and a UI change in one day. By Q4 the same endpoint took ten days and the UI change took four, while velocity fell from 45 story points to 28. Same people. Same hours. Different outcome.
The business heard, “we need more headcount.” The team heard “we need to refactor.” Neither was the right story.
The Interest Payment Metaphor
The metaphor that landed was Ward Cunningham’s financial-debt frame. Budget owners already think in terms of loans, interest, and payback, so this phrasing met them where they were.
In the example that finally worked, a shortcut saved ten days up front. Since then, every payment-related feature cost three extra days. Fourteen features later, that meant 42 extra engineering days — roughly $84,000 in interest on a $20,000 loan.
He understood the problem when I stopped talking about code and started talking about money.

Quantifying the Cost of Inaction
Numbers are the closest. Use data, not high-level terms.
Start with four measurable signals from your own systems: velocity, bug rate, incident frequency, and workaround time. Track story points over 6–12 months and compare that trend to team size. Watch whether bugs per feature are rising, whether production incidents are growing, and how much time engineers spend working around existing code.
Those four signals are far more persuasive than vague talk about “code health.” Pull them from your PM system, bug tracker, incident log, and your team survey.
SonarQube metrics: make the quality story concrete
Objective code-quality metrics help move the conversation from “code smells” to business evidence.
curl -u "$SONAR_TOKEN:" \
  "https://sonarqube.example.com/api/measures/component?component=my-project-key&metricKeys=sqale_index,bugs,vulnerabilities,code_smells,coverage,duplicated_lines_density,reliability_rating,security_rating,maintainability_rating"
Example output:
{
  "component": {
    "id": "AXd2s73_xK1bQH3E2Idr",
    "key": "my-project-key",
    "name": "My Project",
    "measures": [
      { "metric": "sqale_index", "value": "1200" },
      { "metric": "bugs", "value": "27" },
      { "metric": "vulnerabilities", "value": "3" },
      { "metric": "code_smells", "value": "84" },
      { "metric": "coverage", "value": "72.5" },
      { "metric": "duplicated_lines_density", "value": "4.1" },
      { "metric": "reliability_rating", "value": "3" },
      { "metric": "security_rating", "value": "4" },
      { "metric": "maintainability_rating", "value": "2" }
    ]
  }
}
Use the returned values to show technical debt effort, defect risk, maintainability pressure, and business exposure. If you want a tighter story, include debt-related measures like sqale_index with business-facing signals such as reliability_rating and security_rating.
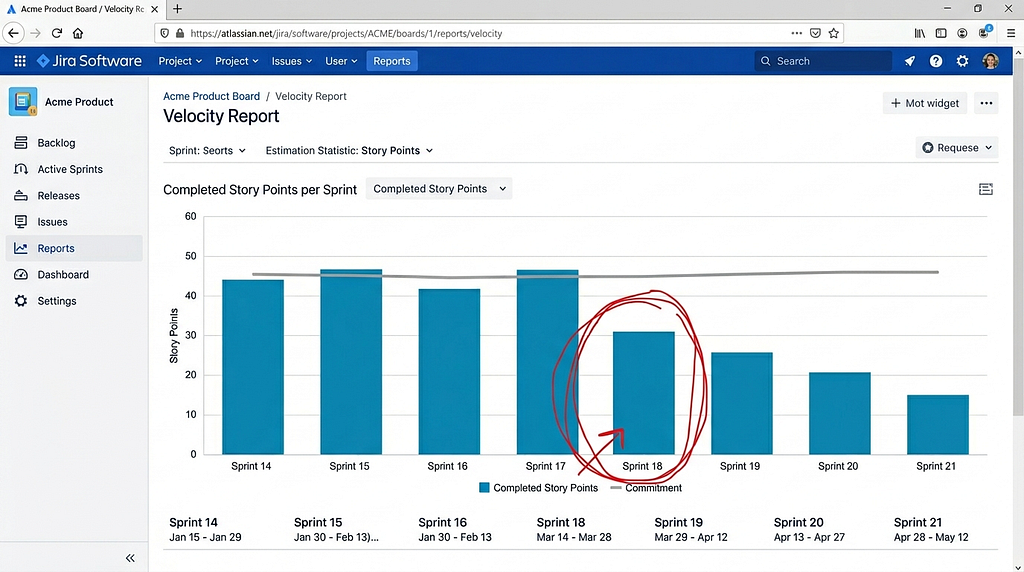
Visualizing the Invisible
Data alone is not enough. Make it memorable. The one chart that non-technical stakeholders will remember is the downward velocity trend with a labeled shortcut point.
A complexity heat map is useful for conversations with engineering leadership. A before/after comparison is useful for the first paydown cycle. A cost projection chart is useful when the audience is looking at the future impact.

Building the Business Case
Treat technical debt paydown like any investment proposal. The most persuasive case answers the three questions executives are really asking:
- What is the business impact?
- What is the risk?
- Why now?
That doesn’t mean your slide deck needs a spreadsheet, but it does mean you should stop talking about “cleanup” and start talking about recovery of capacity.
For example, a six-week effort by three engineers might cost $120K and recover $200K per year in capacity. That is a four-month payback, and it is easier to pitch as “engineering velocity investment” than as a refactor.
A useful frame is action versus inaction. Option A is a small investment now with a measurable uplift. Option B is the same team burning more time every month on workarounds, bugs, and incidents.
If you want the full executive framing, see Part 1: Speaking Executive. The same top-down logic applies: lead with the recommendation, follow with the business impact, then explain risk and timing.
Propose incremental paydown, not a rewrite
Stakeholders are afraid of a full rewrite. A smaller, sustainable approach is easier to sell: dedicate roughly 20% of each sprint to debt paydown, keep features shipping, and show measurable improvement in six weeks.
This is usually enough to make progress without triggering the “engineering disappears” reaction.
Prioritization: What to Fix First
Use two dimensions: pain and effort.
High-pain, low-effort work is where you start: quick wins that build credibility. High-pain, high-effort work still matters, but it should be planned as a project. Low-pain, low-effort items are worth improving when you are already nearby. Low-pain, high-effort work is usually a poor return on investment.

Celebrating Wins
Don’t let debt paydown happen in stealth mode. The most important part of a reduction effort is not just the work itself, but the story you tell afterward.
Measure the outcome. Show the velocity improvement, the bug-rate decline, and any reduction in incidents. Then make the case for what those results mean: more reliable delivery, fewer surprise outages, and a lower cost of future changes.
That measurement becomes a feedback loop. When you quantify the value of debt reduction, you make it easier to justify the next effort and to argue for keeping future debt from accumulating. Stakeholders are much more comfortable funding maintenance if they can see the payoff.
What to Do Monday Morning
- Pull velocity for the last 12 months.
- Pull bug-rate and incident trends.
- Run a SonarQube metrics query for the codebase.
- Identify the stakeholder most frustrated with speed.
- Share the chart, explain it as interest, and propose 20% sprint allocation.
Ask for investment in capacity, not permission to refactor.
Technical debt is invisible to everyone except the engineers who live in it. Your job is to make it visible, quantify it, and turn it into a business decision.
Resources:
- Ward Cunningham: The WyCash Portfolio Management System (original technical debt metaphor)
- Martin Fowler: Technical Debt Quadrant
- Google SRE Book: Eliminating Toil
- CodeClimate: Code Quality Metrics
- SonarQube: Continuous Code Quality
Series Navigation
Previous Article: Writing Technical Documents That Non-Technical People Actually Read (Part 6)
Next Article: Cross-Functional Communication: Engineering, Product, and Design (Part 8 — Series Finale, Coming soon!)
Coming Up: The series finale — collaborating across disciplines with different languages and priorities
This is Part 7 of the Technical Communication series. Read Part 1: Speaking Executive, Part 2: Navigating Executive Disagreement, Part 3: The Technical Presentation Playbook, Part 4: The Architecture Review Survival Guide, Part 5: The Design Review Playbook, and Part 6: Writing Technical Documents.
About the Author: Daniel Stauffer is an Enterprise Architect who has successfully advocated for technical debt paydown across fintech, healthcare, and e-commerce organizations. He believes the best engineers are the ones who can explain why maintenance matters — in dollars, not jargon.
Tags: #TechnicalCommunication #EngineeringLeadership #TechnicalDebt #Refactoring #StakeholderManagement #SoftwareEngineering #CodeQuality #VelocityMetrics
Communicating Technical Debt to Non-Technical Stakeholders was originally published in Level Up Coding on Medium, where people are continuing the conversation by highlighting and responding to this story.