Member-only story
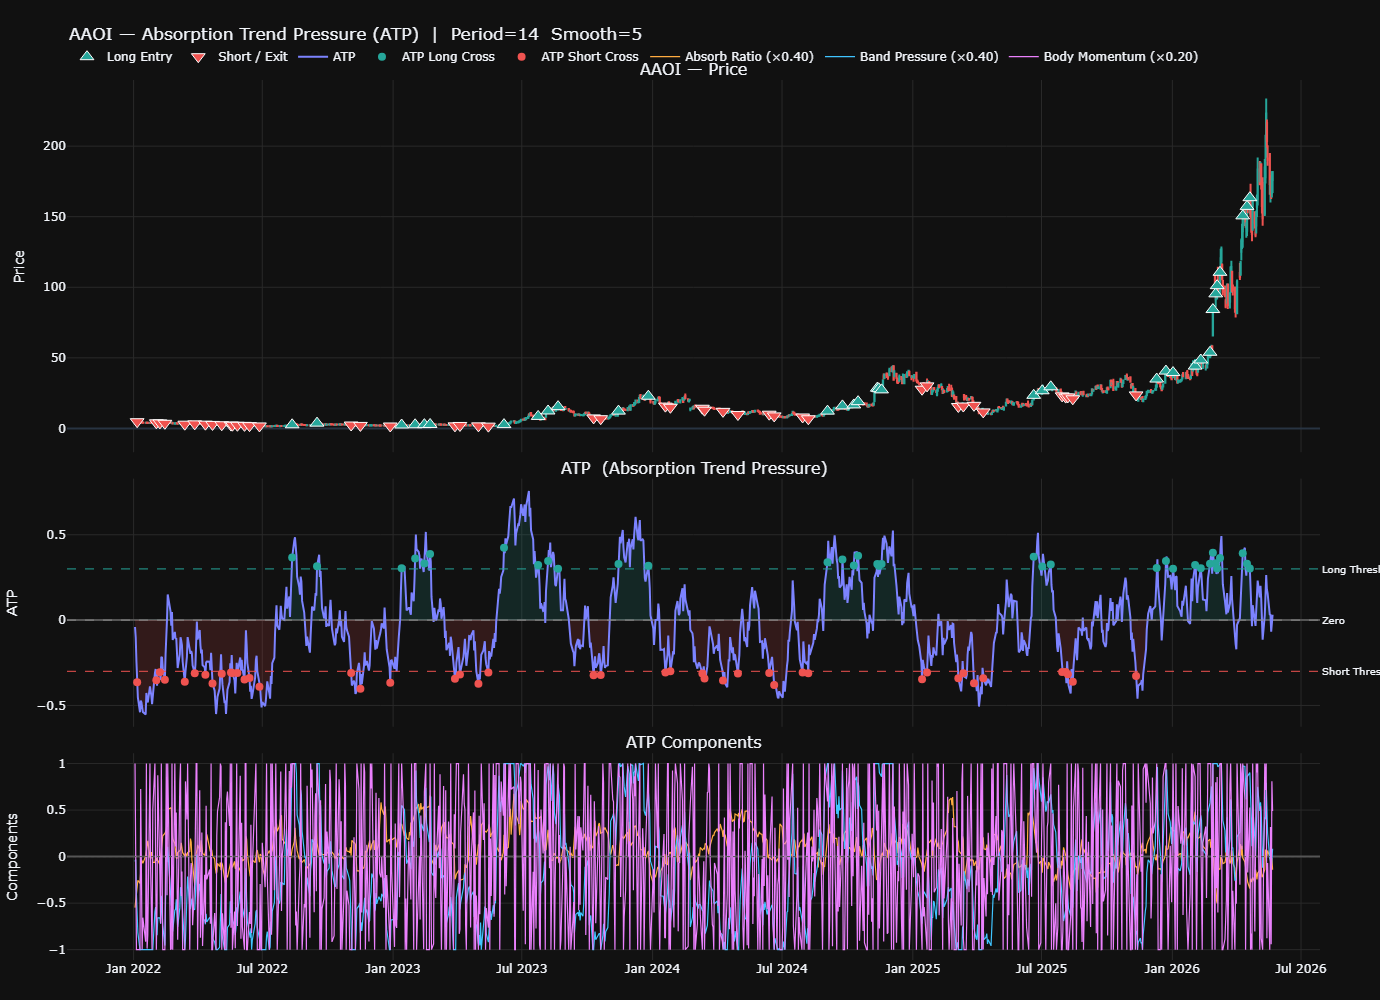
Can a Pressure-Based Oscillator Beat Buy & Hold Across 40 Stocks?
Most indicators tell you where price has been. ATP was built to detect where pressure is building — before the move happens. Here’s what 40 stocks and decades of data revealed.
 Kryptera4 min read·Just now
--
Download Here: Absorption Trend Pressure (ATP) Indicator & Strategy : Beat Buy & Hold Across 40 Stocks
The Lagging Indicator Trap
Every quant trader runs into the same wall eventually. You backtest a moving average crossover, a standard RSI threshold, a classic MACD divergence — and yes, it works. On the in-sample data. The moment you push it forward into out-of-sample territory, returns evaporate. Drawdowns expand. The edge was never structural; it was noise wearing the mask of signal.
The problem isn’t the indicators themselves. The problem is what they’re measuring: price momentum *after* direction has already established itself. By the time a 50/200 MA cross fires, the trend is weeks old. You’re not catching the move — you’re chasing its shadow.
The core question: Is there a systematic way to detect directional pressure building beneath market structure — before the larger expansion occurs — and does that edge persist…