
 Written by Yashu Golastaff writerReviewed by Allen Scottstaff editorWritten by Yashu Golastaff writerReviewed by Allen Scottstaff editor
Bitcoin bottom? These four charts hint at BTC price dropping to $50K
MarketsPublishedJun 9, 2026A $50,000 Bitcoin price target remains in play despite BTC maintaining above $60,000 support for now, as multiple indicators warn the bottom may not be in.

Bitcoin (BTC) bulls successfully defended the $60,000 psychological support during last week’s 13% correction.
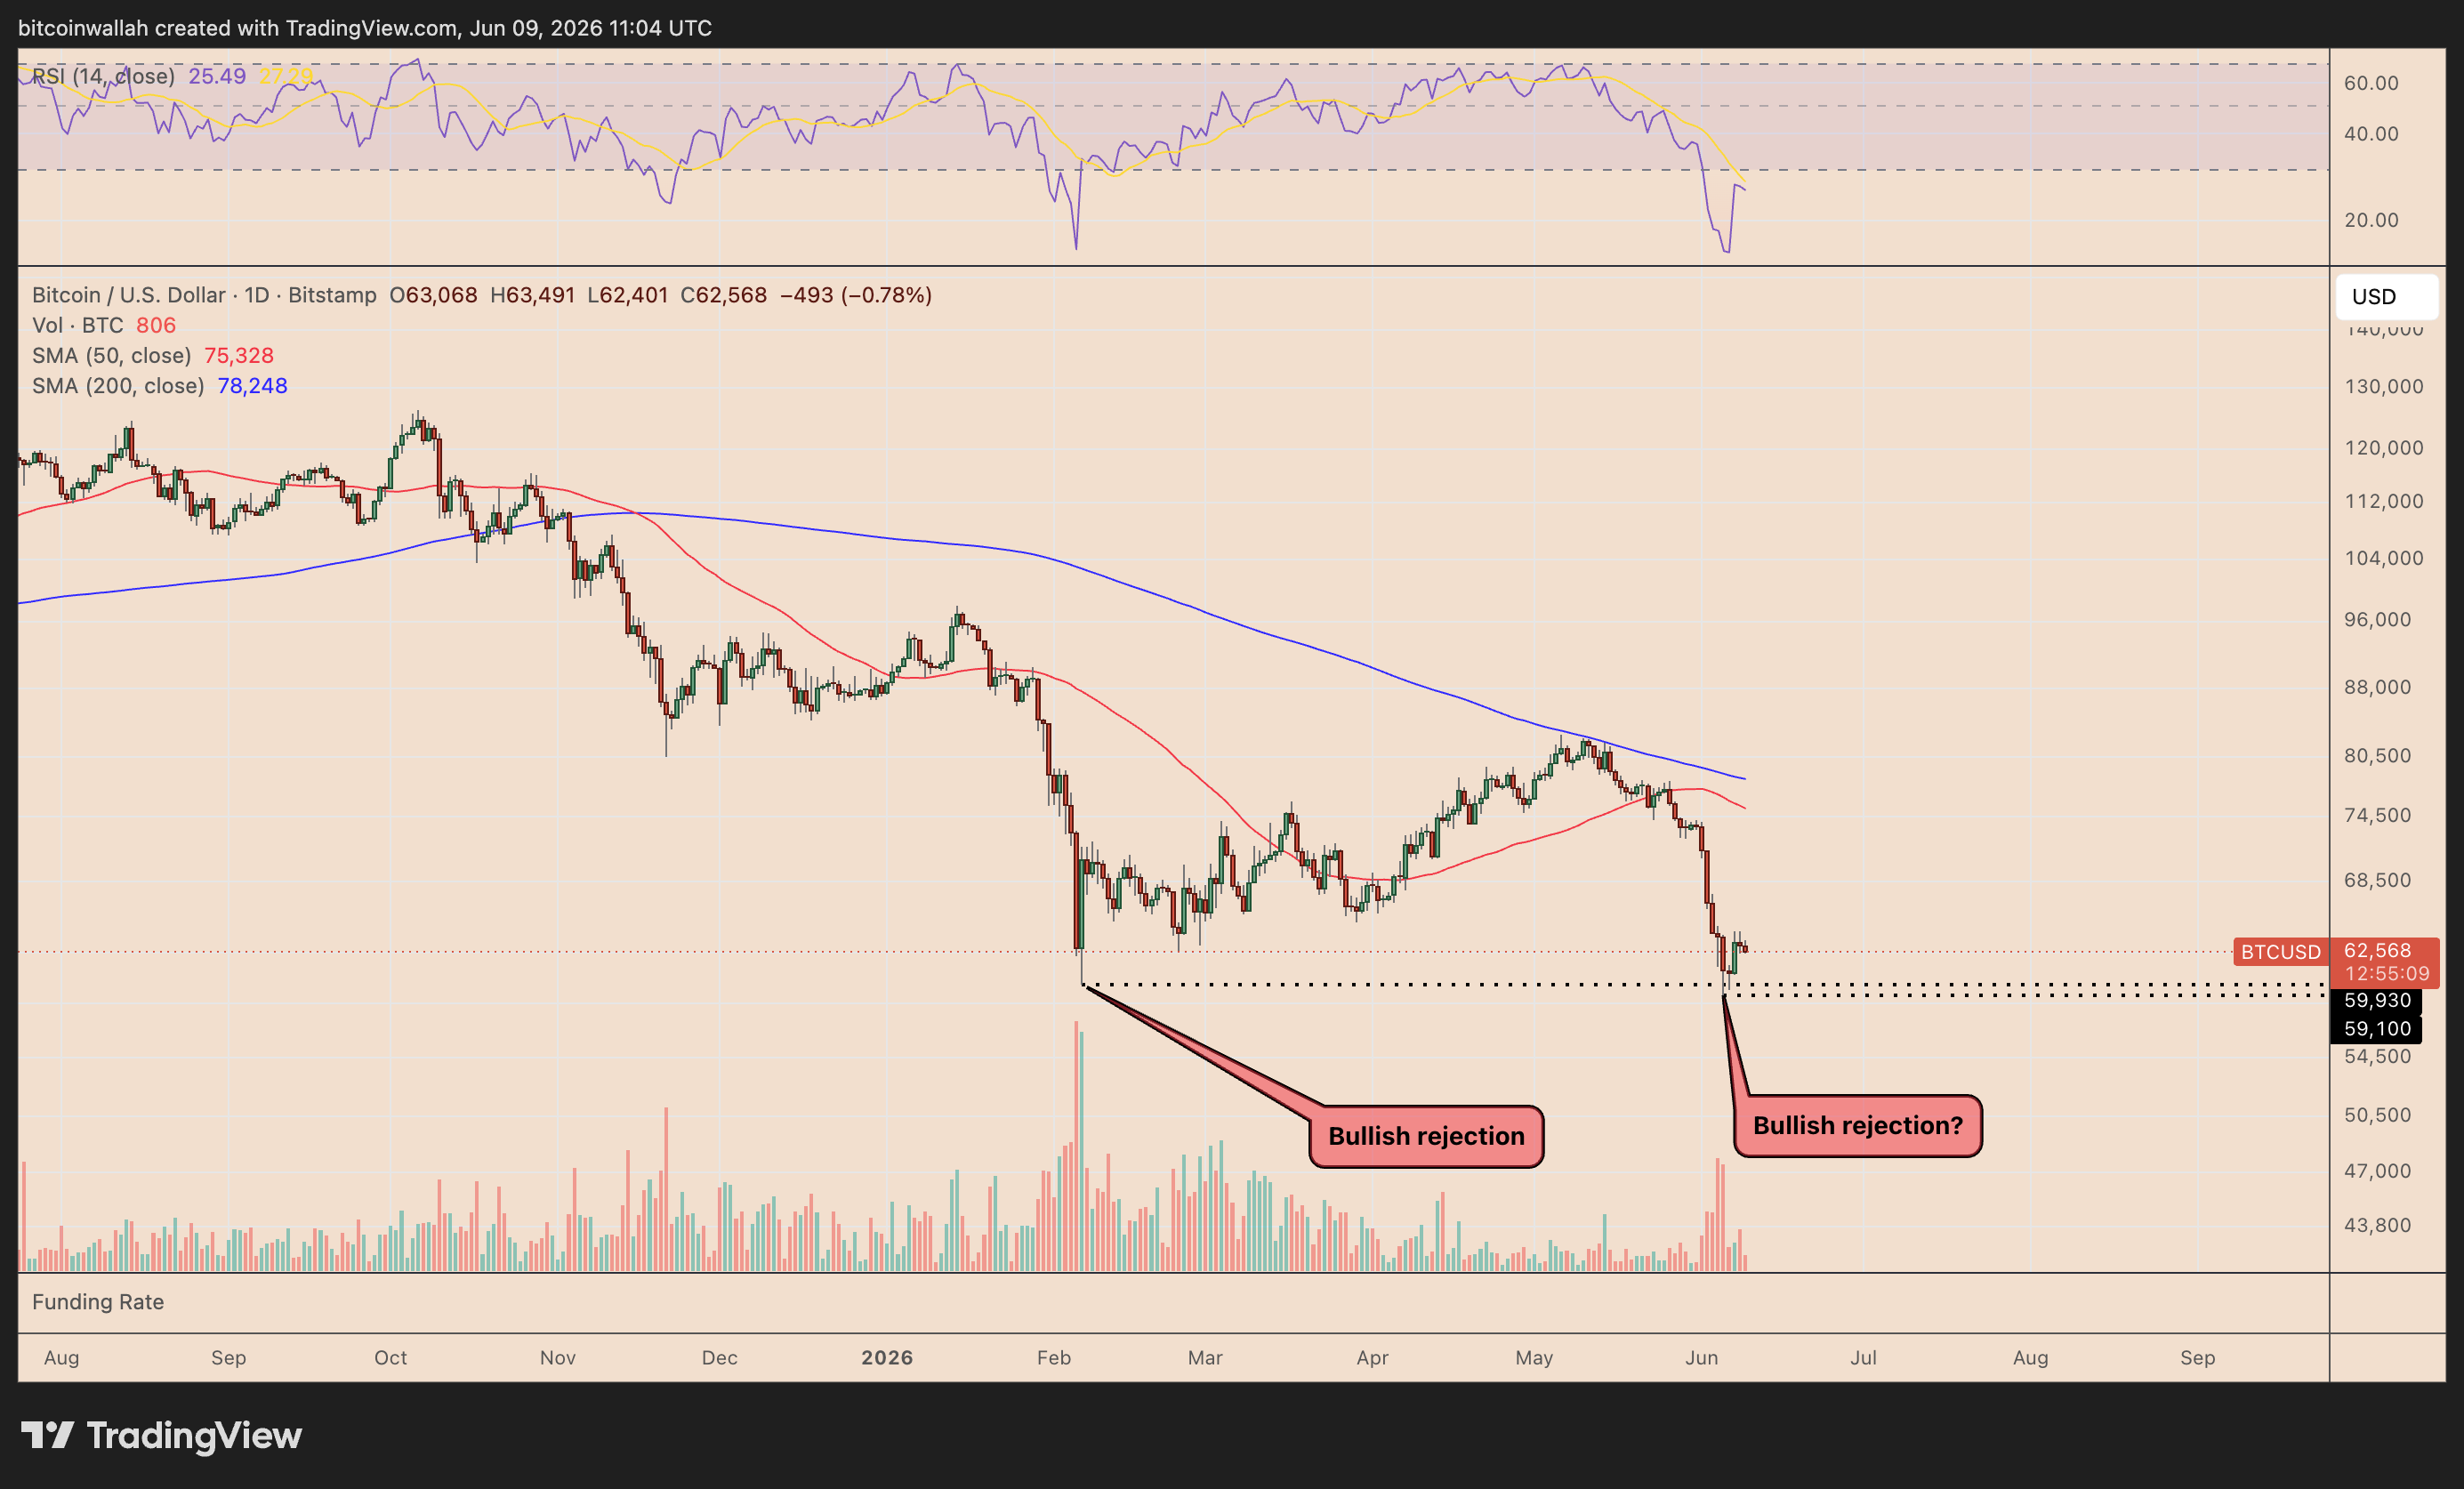
BTC/USD daily chart. Source: TradingView
However, the rebound has not fully erased downside risks, with some traders warning that a deeper breakdown remains possible as the US–Iran tensions and fading rate-cut expectations weigh on risk appetite.
Several Bitcoin valuation and technical indicators now support that scenario, suggesting BTC could still revisit $50,000 or lower levels in the coming weeks.
Key takeaways:
- Bitcoin trades near its average production cost of $62,650, but risks dropping toward its lower electrical cost of $50,120.
- Glassnode's MVRV bands show BTC below its lower valuation zone, with the next deep-value magnet near $50,437.
Bitcoin breaks down below average production cost
One of the key warning signals comes from the Bitcoin production cost model, which compares BTC’s market price with the estimated average cost of mining one Bitcoin.
The model, shared by Capriole Investments Founder Charles Edwards, shows Bitcoin trading near its production cost of around $62,650. That means miners are, on average, close to breaking even at current prices.
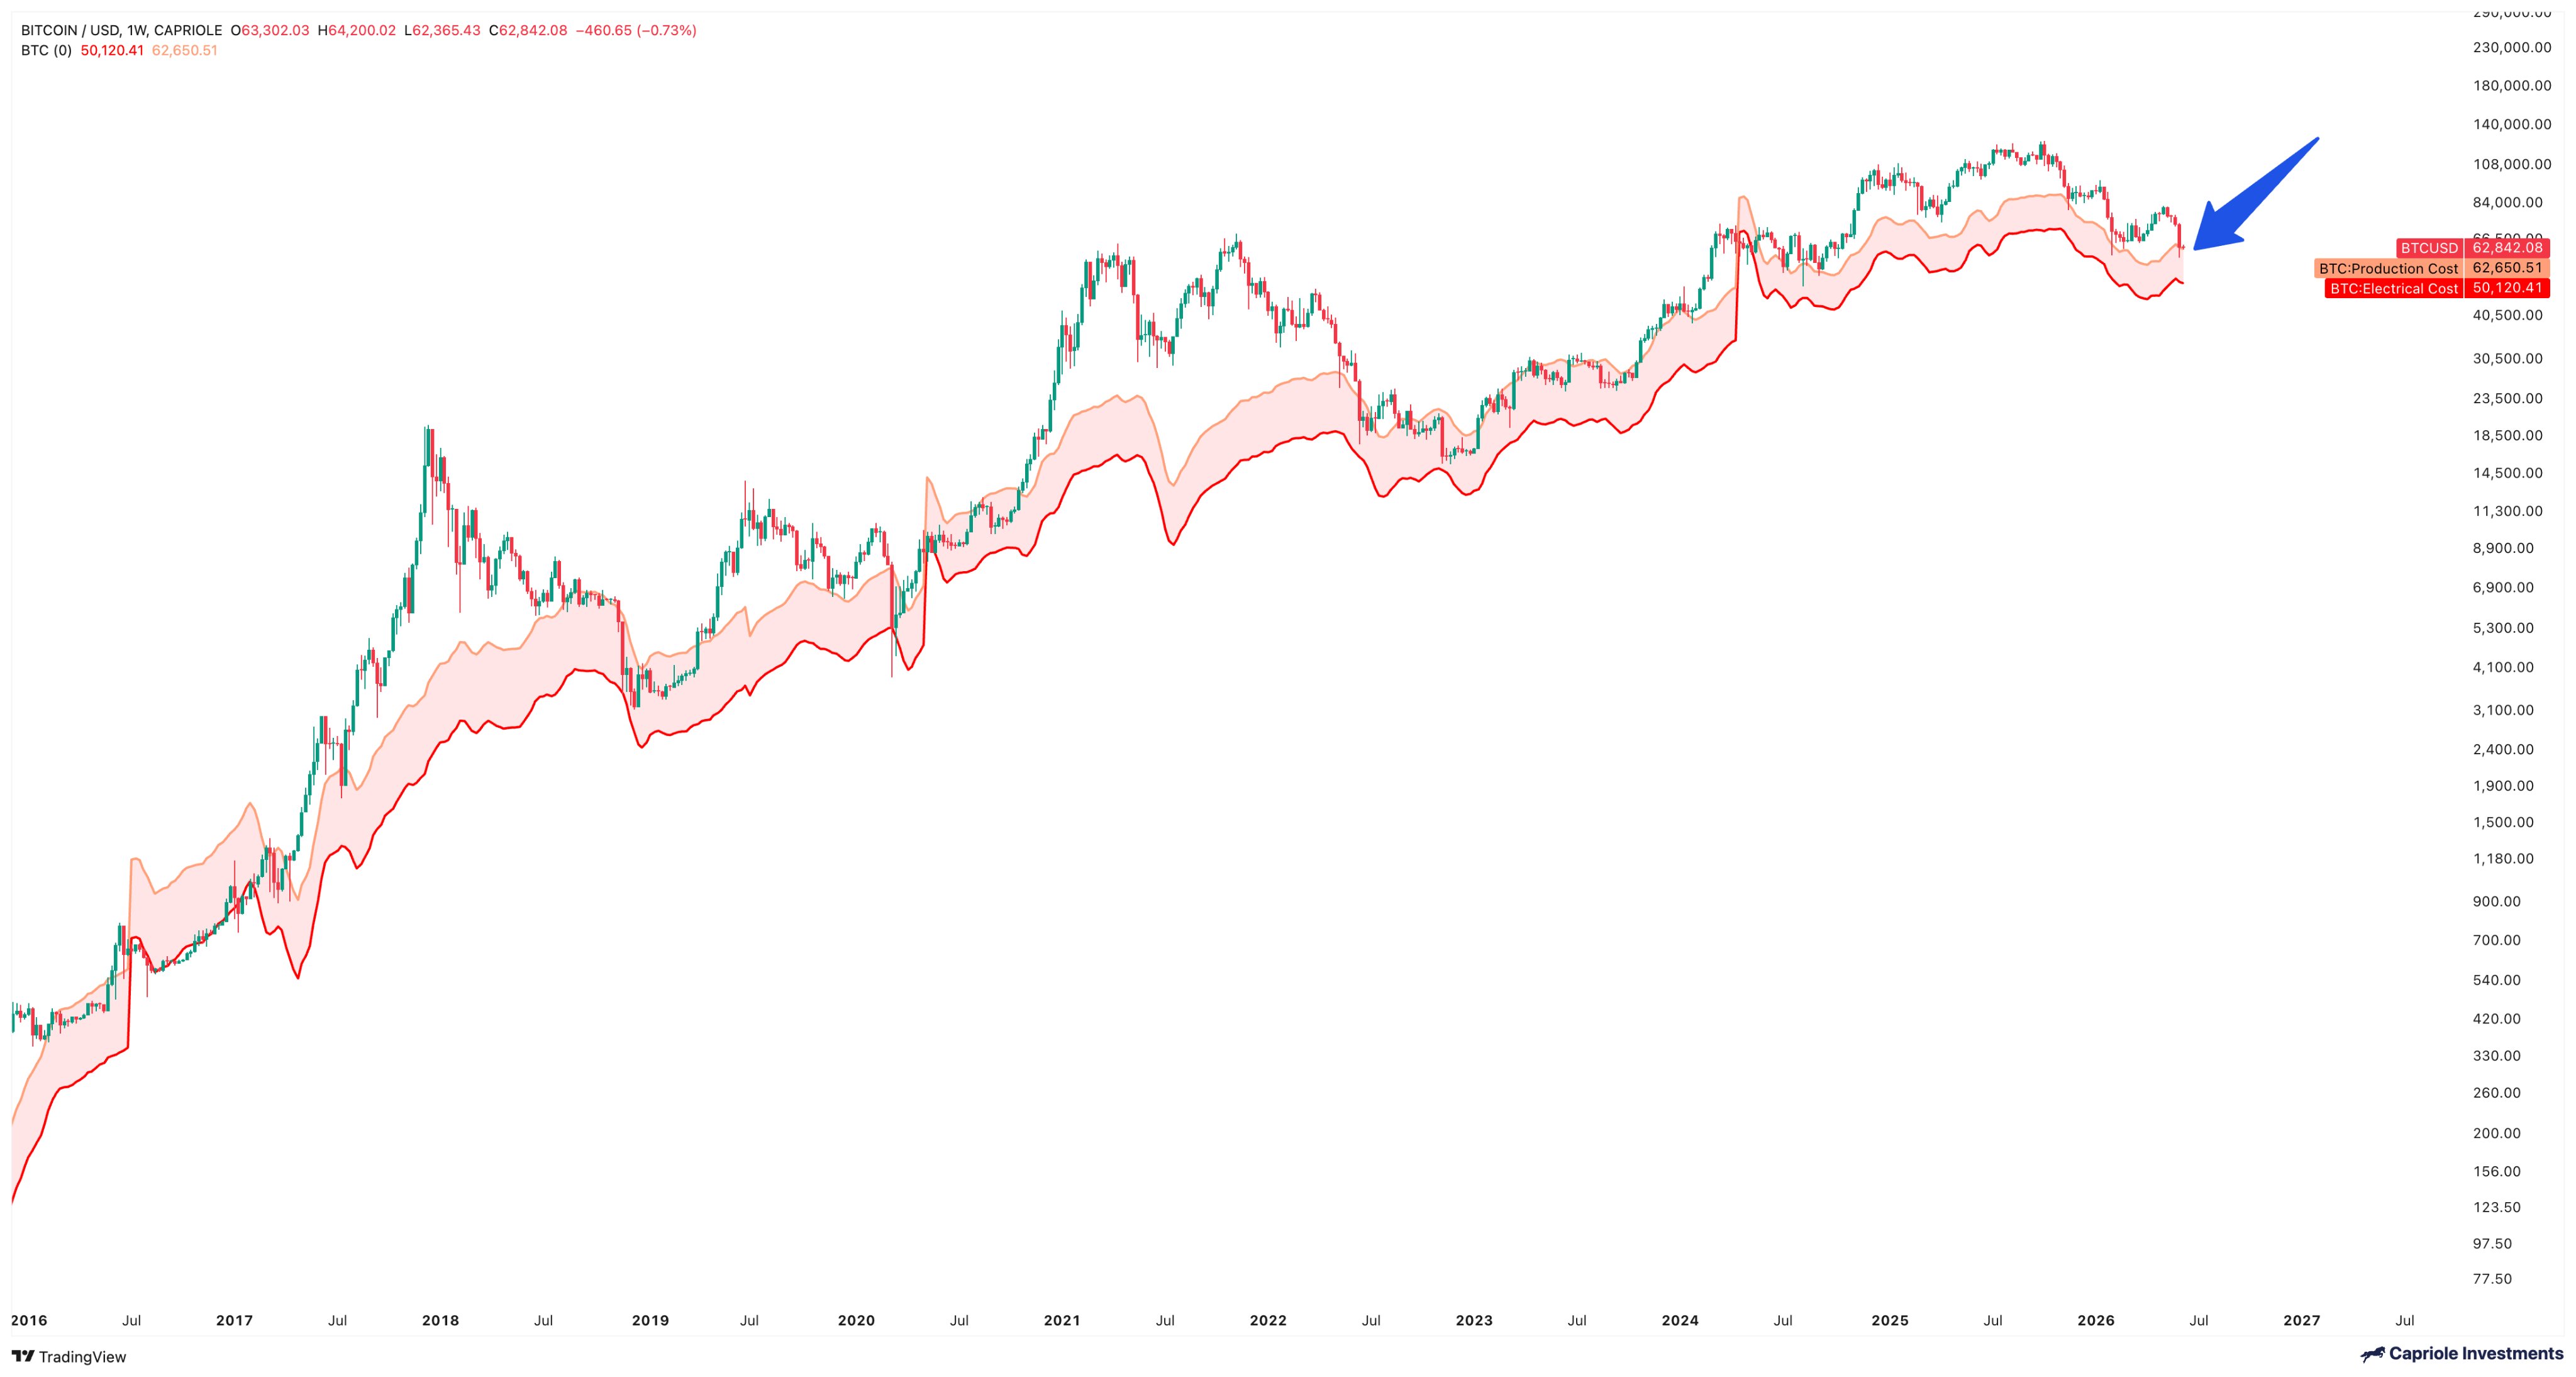
BTC/USD weekly chart vs. production cost. Source: Capriole Investments
This level has historically acted as an important long-term value zone. During previous bear-market corrections, Bitcoin often found strong demand when the price fell into the band between the production cost and the lower electrical cost estimate.
That lower boundary now sits near $50,120, according to the chart.
In other words, BTC is already testing the upper end of a major miner-cost support zone. If sellers push the price decisively below the current production-cost area, the next major valuation floor could sit near the electrical-cost level around $50,000.
BTC realized price indicator reveals $37,500 bottom
Bitcoin’s realized price, the average cost basis of all BTC holders, is currently near $53,600, according to the chart shared by analyst Follis.
Historically, Bitcoin has not formed a major cycle bottom without first trading below the realized price. BTC fell about 58% below realized price in 2011, 49% in 2015, 47% in 2018, and 34% in 2022.
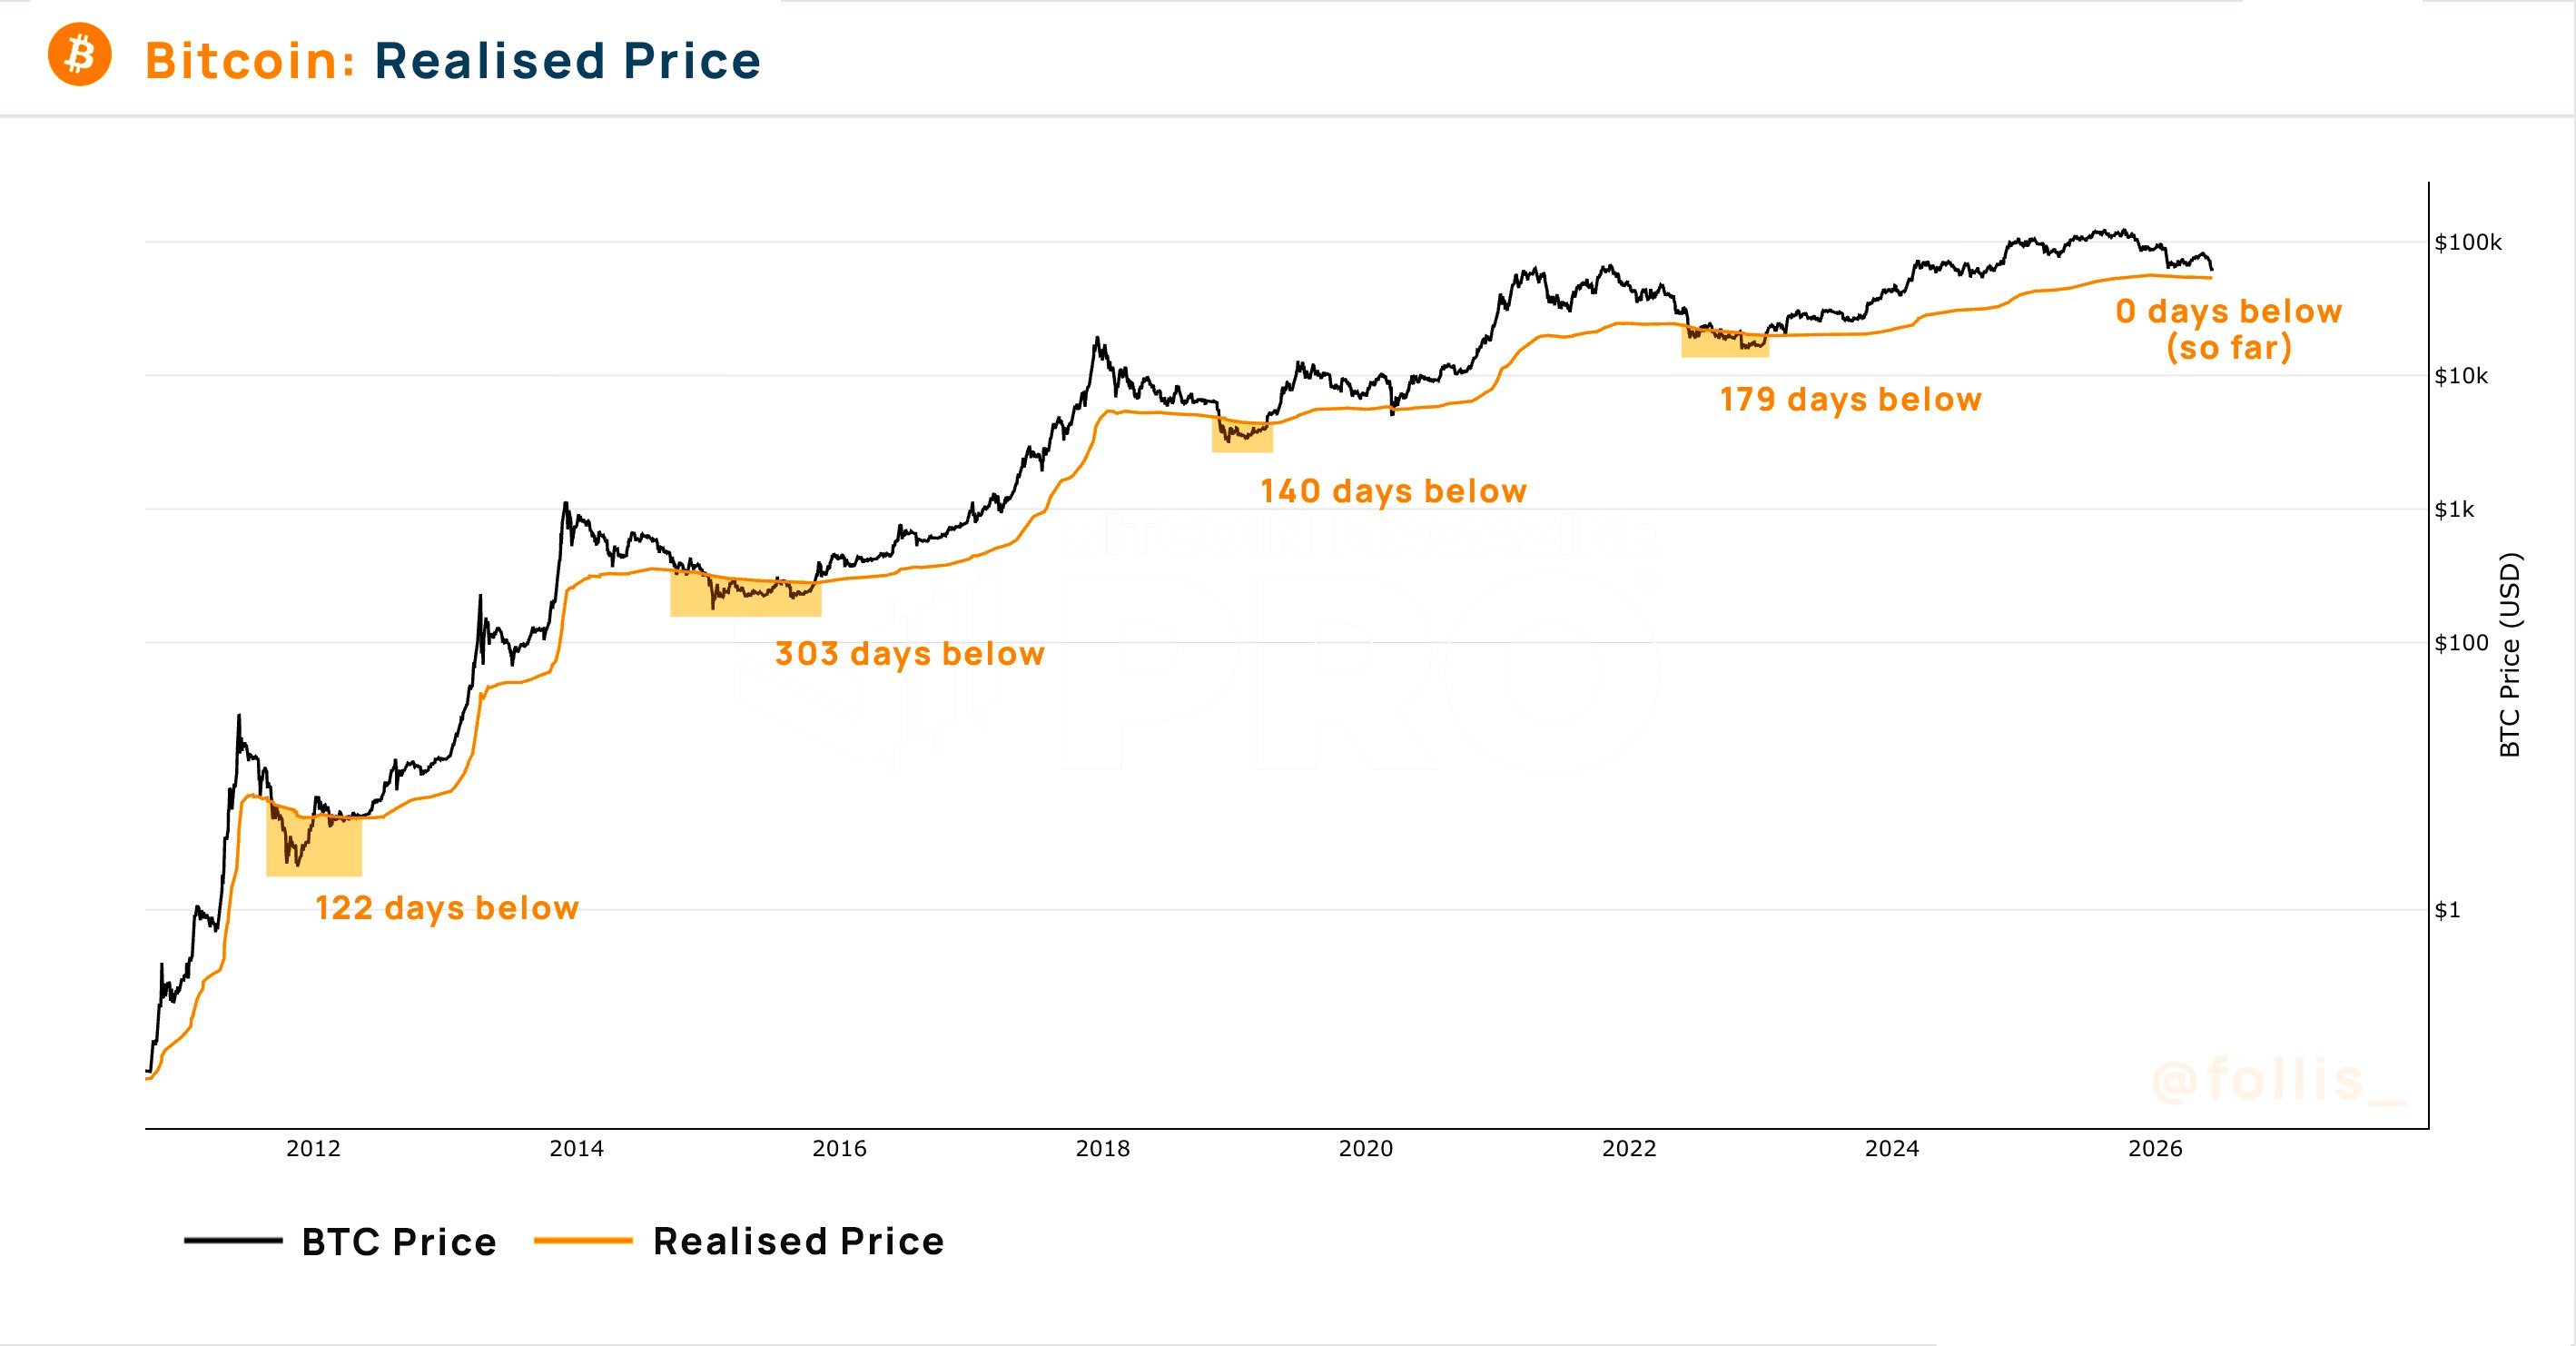
Bitcoin realized price vs. spot price. Source: TradingView/Follis
The drawdowns have become shallower over time, but even a smaller 20%–30% drop below today’s realized price would imply a bottom zone between roughly $37,500 and $42,800.
So far, Bitcoin has spent zero days below realized price in this cycle, compared with 179 days in 2022, 140 days in 2018, 303 days in 2015, and 122 days in 2011.
Related: BTC price bottom not due until Q4? Five things to know in Bitcoin this week
That keeps the possibility of a bottom in Q4 2026 in play. A decisive break below $60,000 could send BTC toward realized price near $53,600 first, before opening the door to a deeper capitulation zone below $50,000.
Bitcoin MVRV bands suggest price drop $50,000 is plausible
Bitcoin’s MVRV pricing bands also point to a possible deeper correction toward $50,000.
The model compares BTC’s market price with valuation zones based on how expensive or cheap Bitcoin appears versus its long-term average. Historically, these bands have acted as price magnets during major cycle moves.
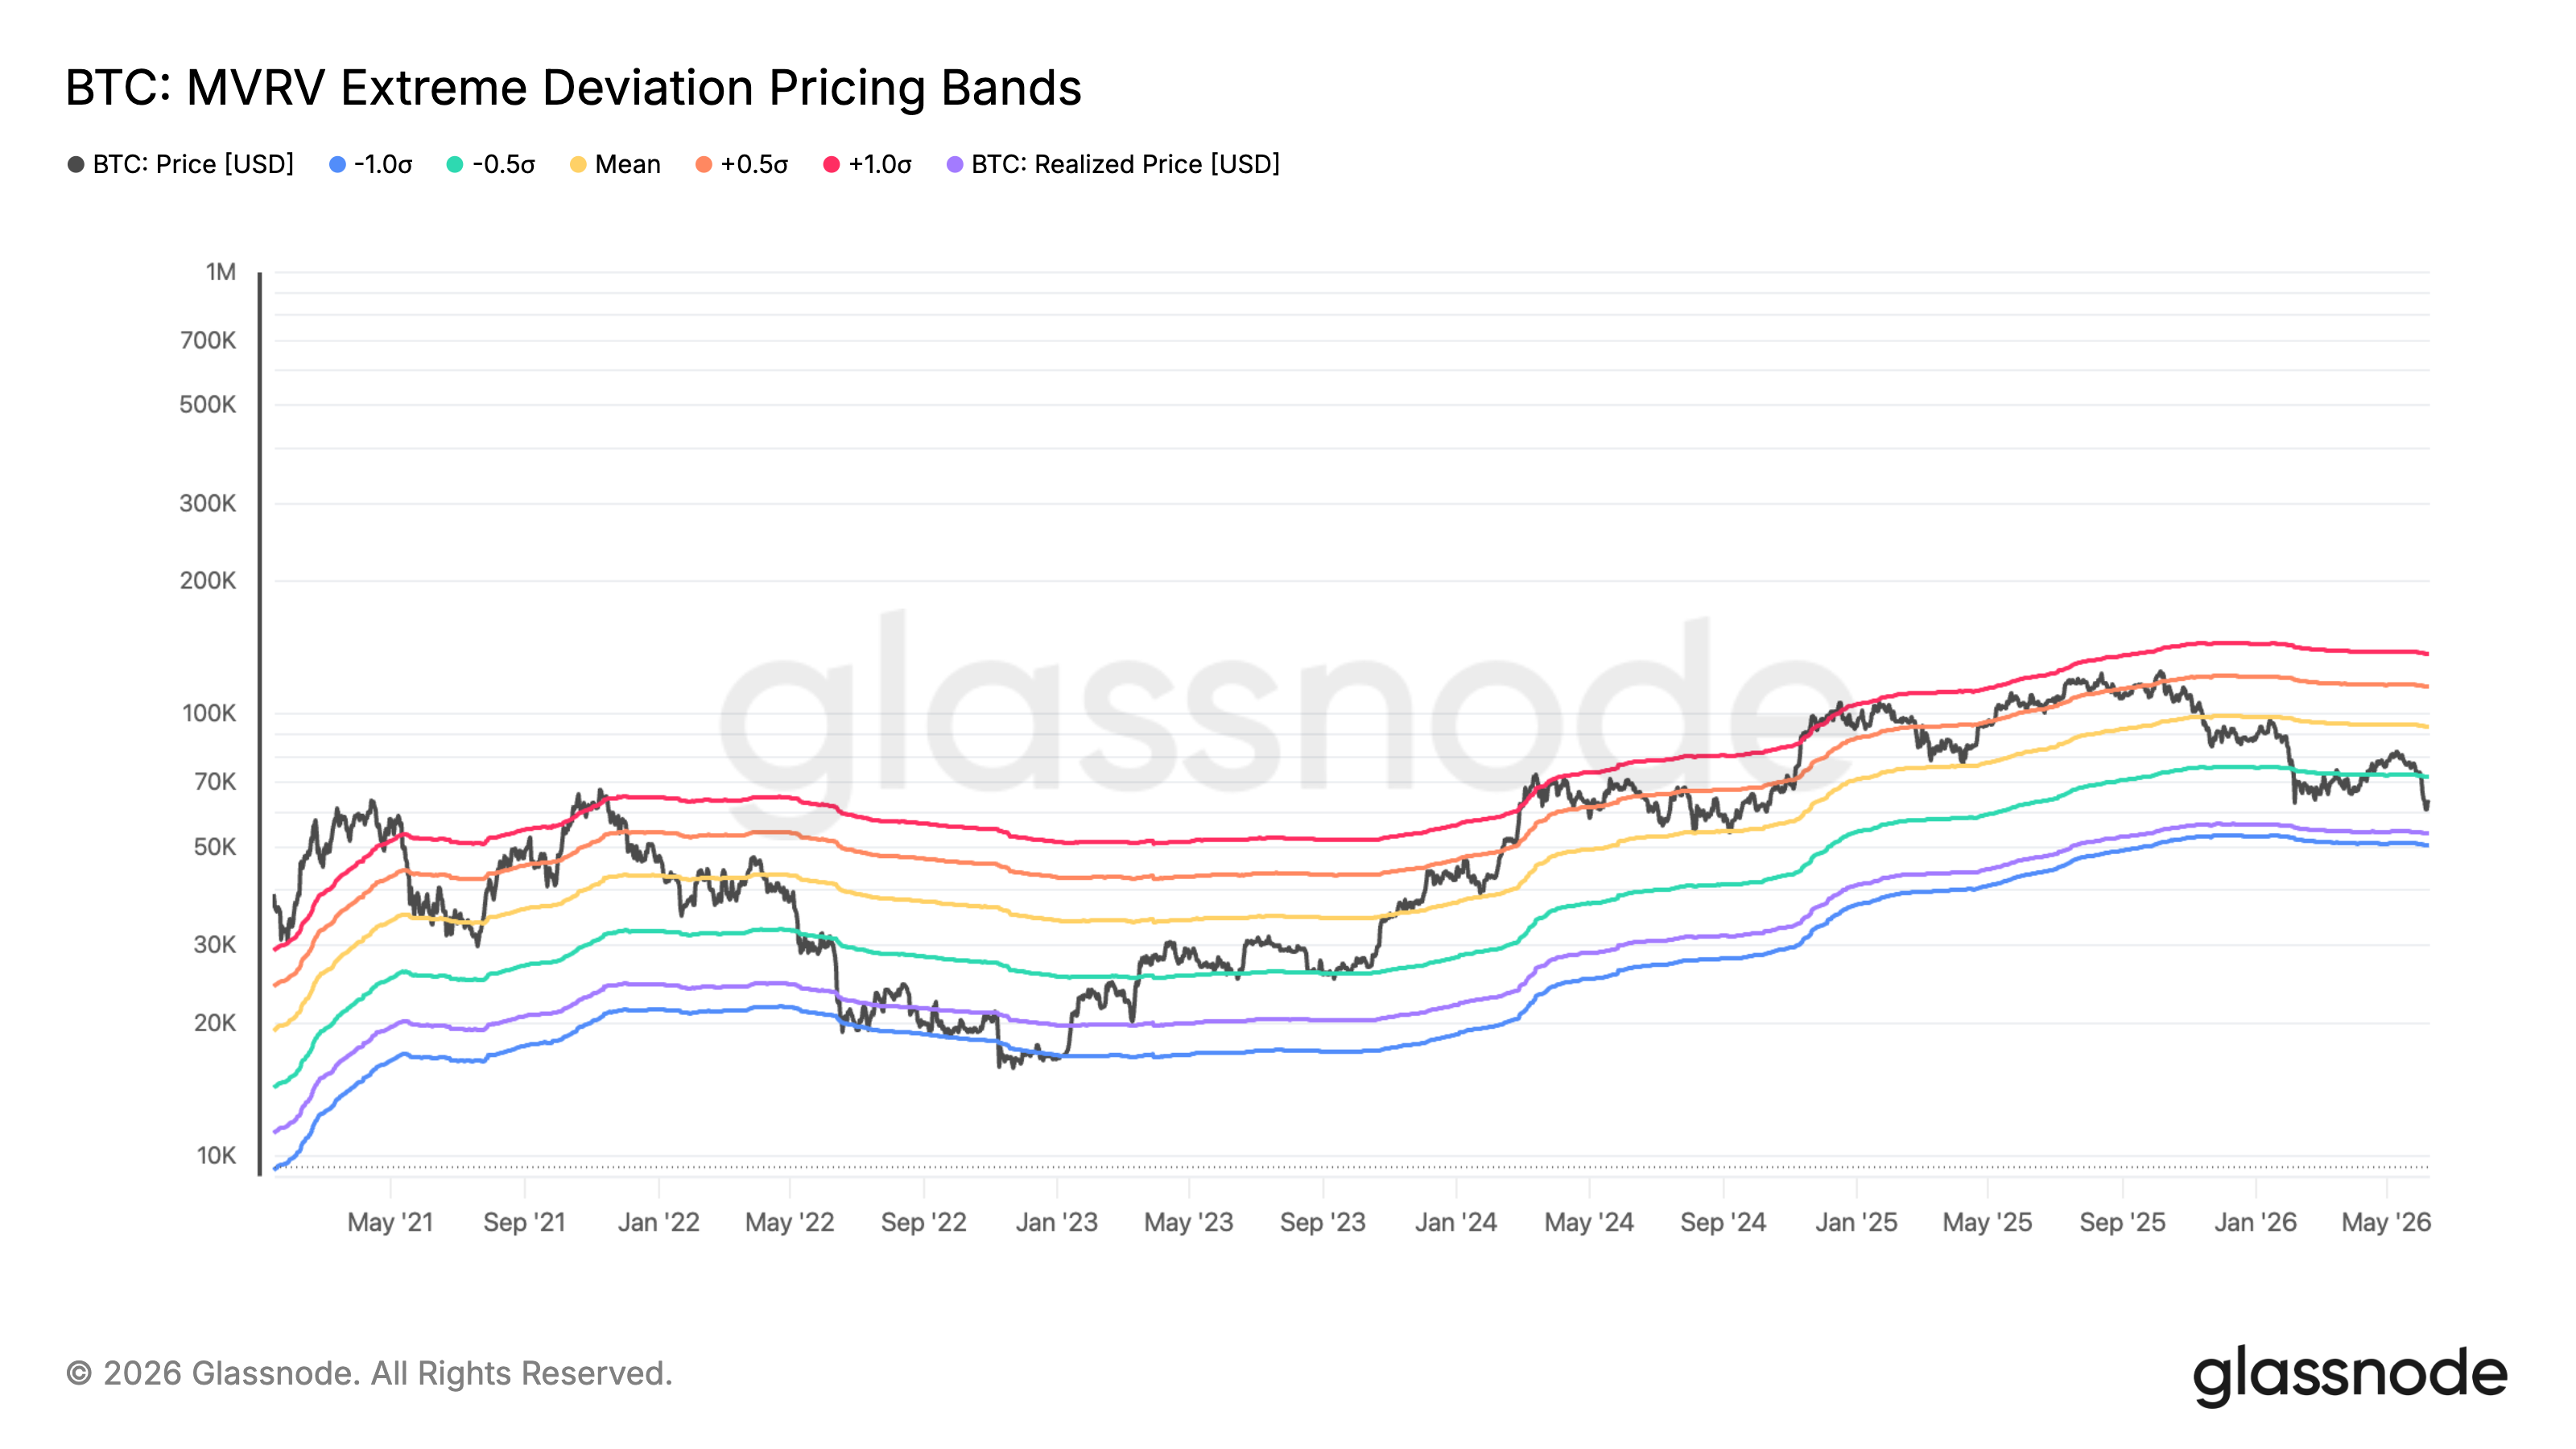
Bitcoin MVRV extreme deviation pricing bands. Source: Glassnode
In the 2021 bull market, Bitcoin repeatedly topped near the upper valuation bands. During the 2022 bear market, the price eventually fell through the average band and gravitated toward the lower bands before forming a bottom.
A similar pattern appeared again during the 2024 correction, when BTC cooled off toward lower valuation zones before recovering.
Now, Bitcoin is trading near $63,000, already below the model’s lower valuation band around $72,035. The next major magnet sits near the deep-value band around $50,000.
That level also sits close to Bitcoin’s realized price near $53,600, making the $50,000–$53,600 area a key on-chain support cluster.
A decisive break below $60,000 would therefore strengthen the case for BTC to revisit this deep-value zone before attempting a durable bottom.
Bitcoin bear flag breakdown keeps $50,000 in play
Bitcoin’s weekly chart shows a possible bear flag breakdown, with BTC slipping from its rising consolidation range after failing below the 50-week SMA near $91,700.
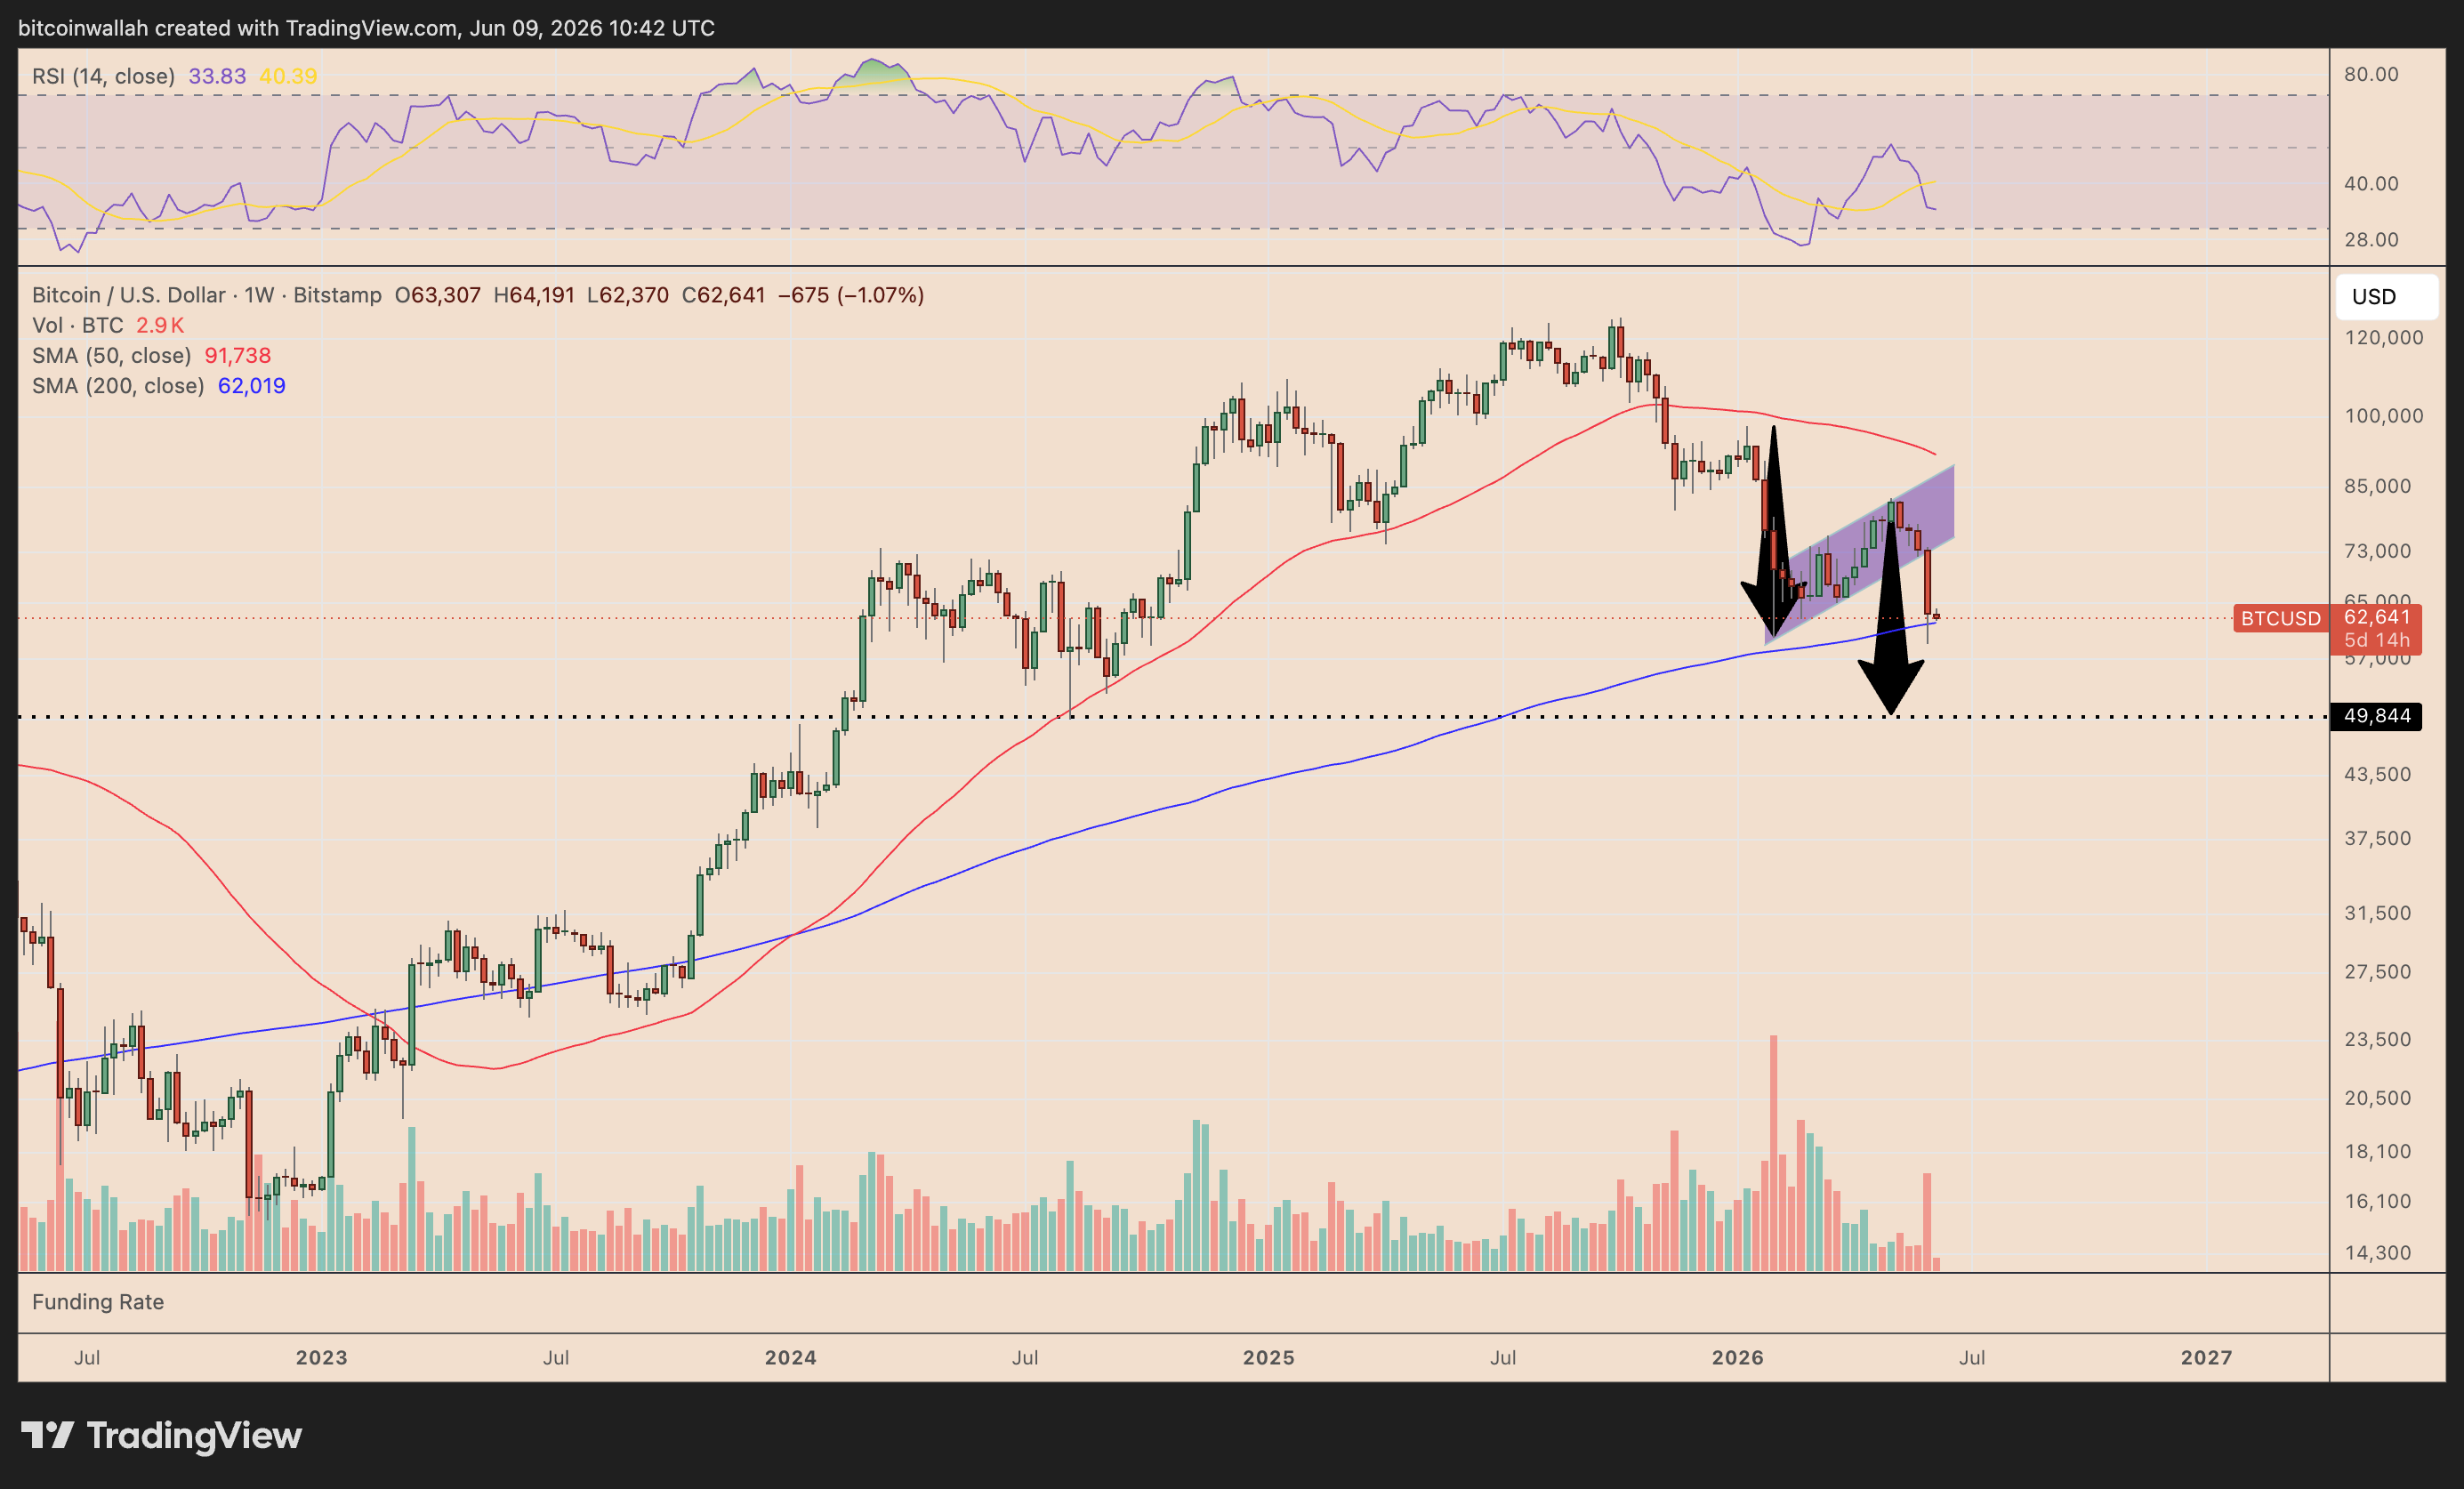
BTC/USD weekly chart. Source: TradingView
The price is now testing the 200-week SMA near $62,000, a key long-term support. A decisive weekly close below it would confirm the bearish setup and open the door to the measured downside target under $50,000.
Weekly relative strength index (RSI) readings near the oversold threshold of 30 also show weak momentum, supporting the view that sellers remain in control unless BTC quickly reclaims the flag support.
This article is produced in accordance with Cointelegraph's Editorial Policy and is intended for informational purposes only. It does not constitute investment advice or recommendations. All investments and trades carry risk; readers are encouraged to conduct independent research.More on the subject
 Bitcoin price slips toward $62K local lows as bear-market history keeps repeating1 hour agoWilliam Suberg
 Bitcoin rebound highlights discount but $162M bid liquidity points to downside risk10 hours agoBiraajmaan Tamuly
 'Best thesis' for Bitcoin accumulation surfaces despite current downside risk: Analyst22 hours agoBiraajmaan TamulyBitcoin price slips toward $62K local lows as bear-market history keeps repeating1 hour agoWilliam SubergBitcoin rebound highlights discount but $162M bid liquidity points to downside risk10 hours agoBiraajmaan Tamuly'Best thesis' for Bitcoin accumulation surfaces despite current downside risk: Analyst22 hours agoBiraajmaan Tamuly