Beyond the Credit Score: 5 Surprising Lessons from Modelling Loan Defaults
 Shubham Malpani4 min read·Just now
--
Hello hello, my fellow connections.
I recently built an Expected Loss Pipeline to evaluate Home Credit Default Risk. I already shared the full project and results. But honestly? The numbers weren’t the interesting part. The thinking behind the numbers was.
And as ChatGPT and LinkedIn influencers say, here are my key learnings from the project, but I do mean it. ;)
1. Why 92% accuracy is sometimes a Failing Grade
For starters (noobs?), a model with 92% accuracy sounds like an oracle. To a credit risk architect (me, lol), it often signals a disaster. In our modelling dataset, the default rate sits at a lean 8.07%. This inherent class imbalance creates a dangerous paradox.
Hear me out.
So if a model just predicted “nobody defaults, ever,” it would be 91.93% accurate. Sounds great. Completely useless for a bank.
A high accuracy score on an imbalanced dataset isn’t a win. It’s a warning sign dressed up as one.
Let me give you an example. Imagine you hire a security guard to catch shoplifters. Out of every 100 customers, 8 are shoplifters. Your guard’s strategy is to let everyone through and never stop anyone. He catches zero shoplifters. But he also never wrongly stops an innocent customer. His “accuracy” is 92% because he correctly handled 92 out of 100 people.
That guard is useless. Your bank’s loan officer using a model that always says “approve” is the same thing. The 8 defaulters walk through every time, and the bank loses money on every single one.
Accuracy as a metric rewards the model for correctly identifying the large group (non-defaulters) while completely ignoring how badly it handles the small group (defaulters).
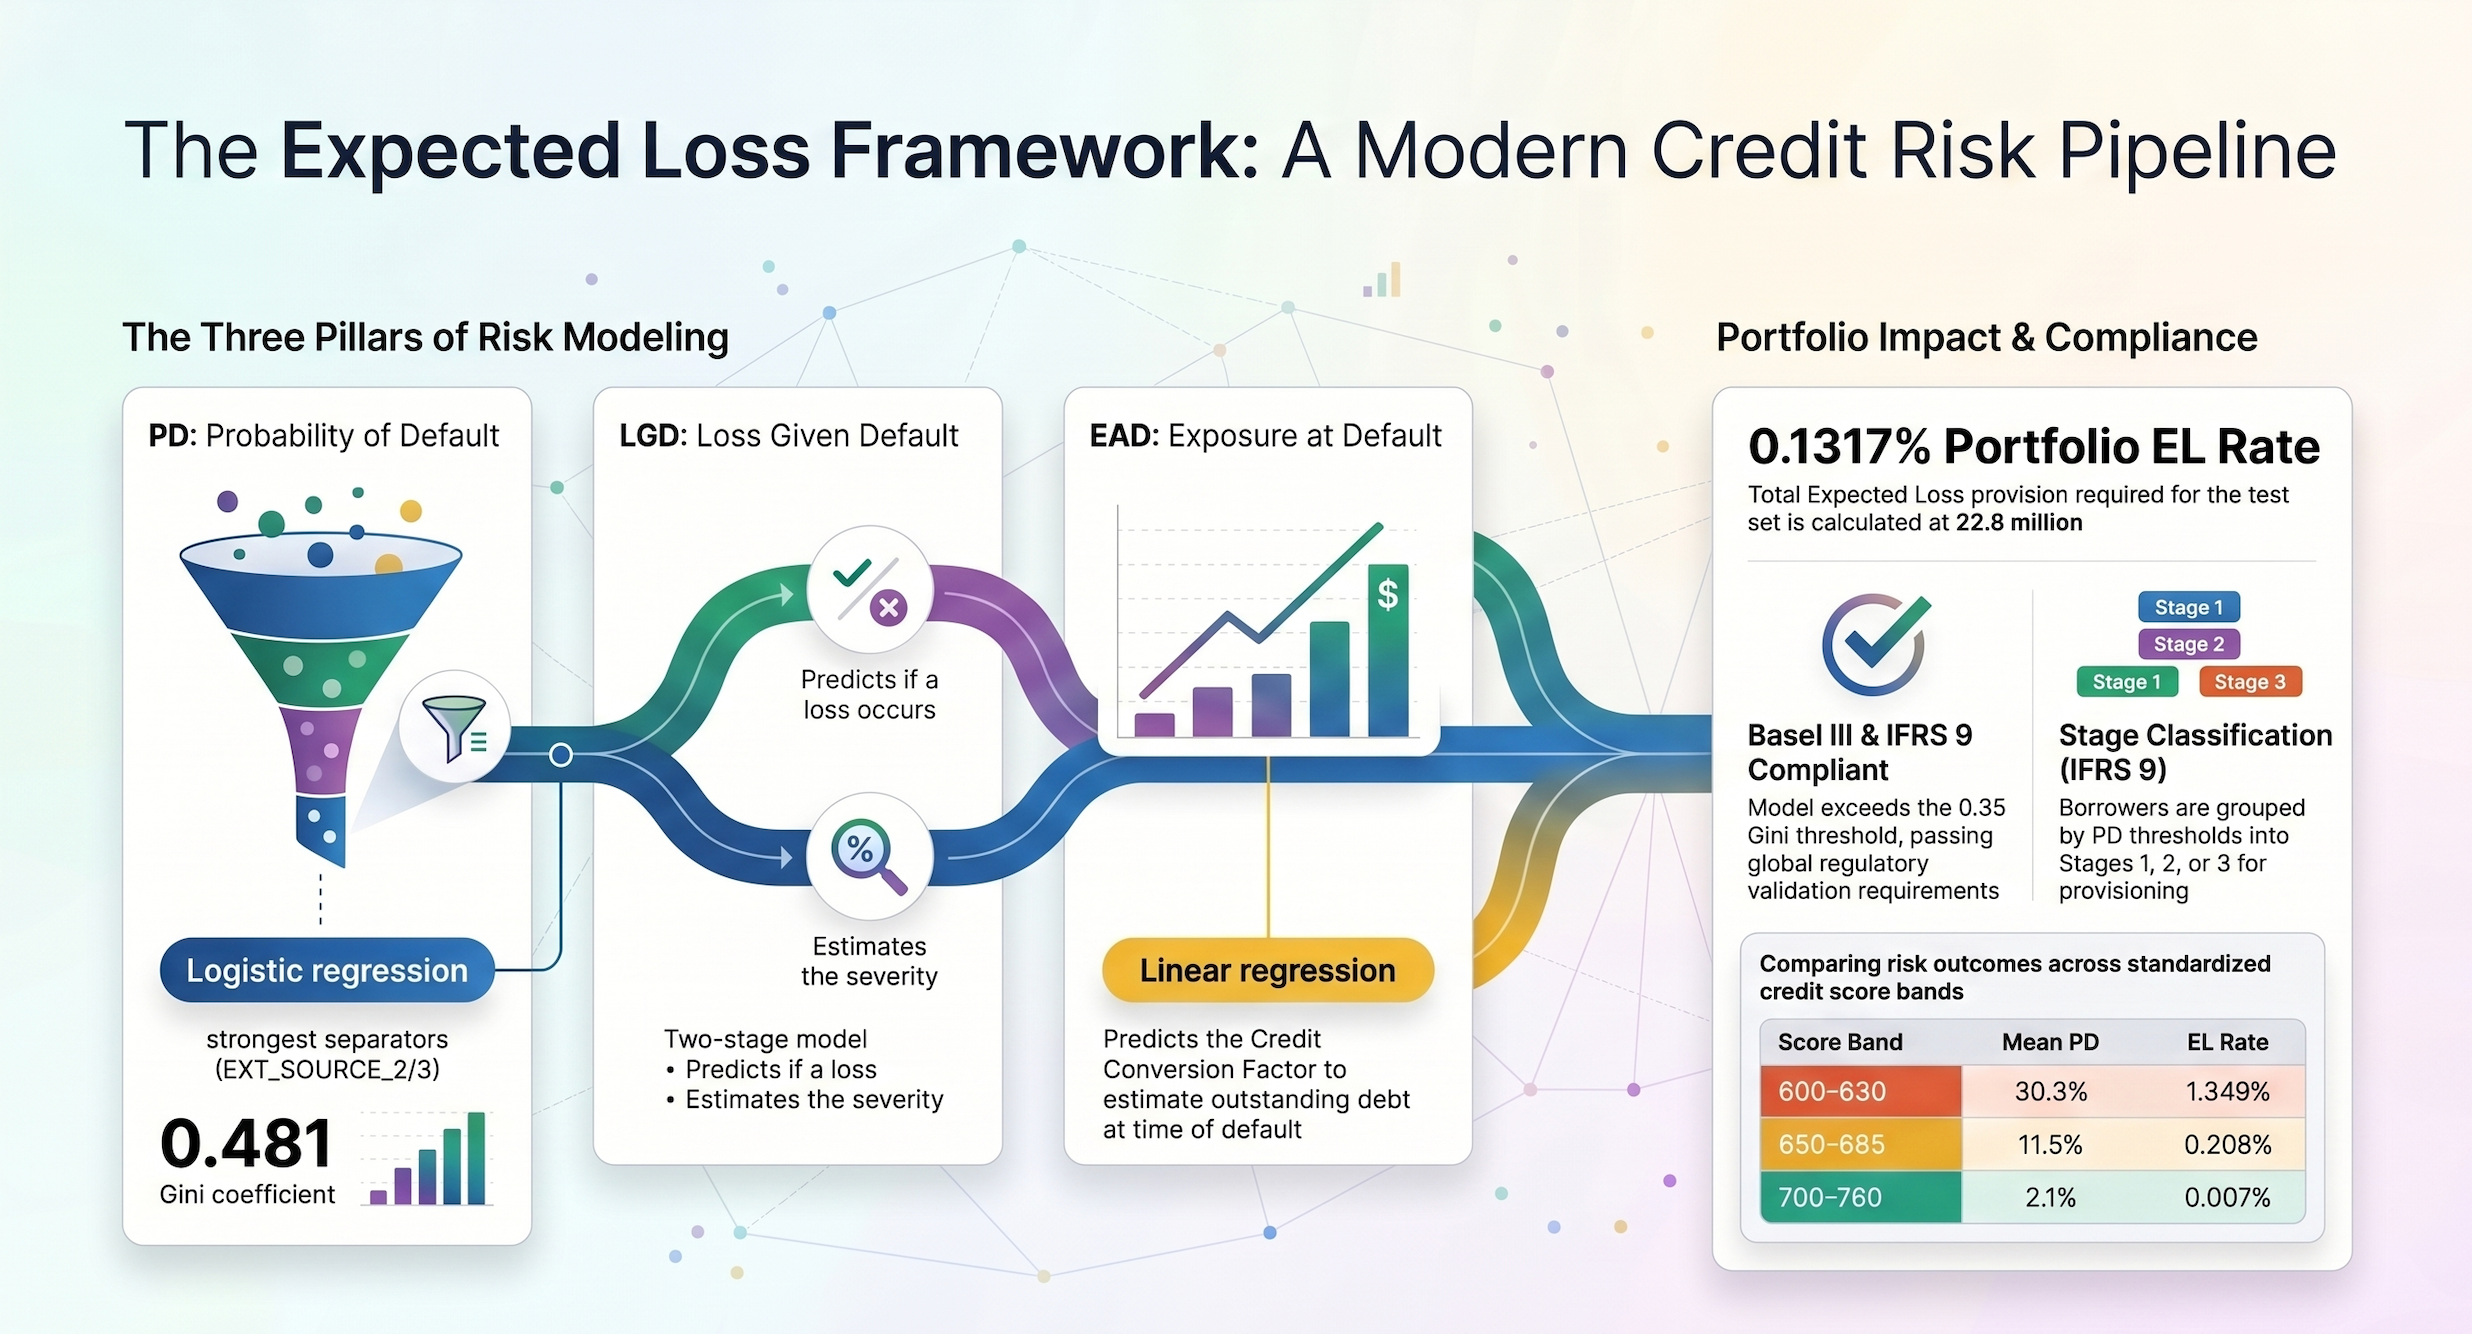
This is the class imbalance trap, and it catches people off guard (no pun intended) every time. The fix isn’t better data. It’s better metrics. AUROC and the Gini Coefficient tell you how well your model ranks risky borrowers, not just whether it guesses right on average.
2. Your best predictor might be missing for half of your applicants
Real-world credit data is a minefield of “ghost values.” In this pipeline, 41% of the feature set contained more than 30% missing values. However, the most striking architectural challenge was EXT_SOURCE_1. Despite being one of the most powerful predictors of default, it was missing for over 56% of applicants.
Building a reliable pipeline when half of your best data is missing requires sophisticated handling, such as median imputation for numerical values and “Unknown” tagging for categorical gaps. That’s not a data quality problem. That’s a real-world problem. People filling out a mobile loan application at 11 pm don’t have their apartment’s common area dimensions handy. (COMMONAREA_AVG was missing in nearly 70% of cases, for what it’s worth.)
For the lender, this missingness represents the high cost of data collection versus the necessity of model reliability.
The lesson: missingness isn’t random noise. It often tells you something about the borrower’s profile itself.
3. Third-party data quietly runs the show
After calculating Information Value across all features, three external credit bureau sources dominated everything else.
EXT_SOURCE_3 (IV: 0.313) and EXT_SOURCE_2 (IV: 0.303) both crossed the industry threshold for “strong predictor.” Your occupation type, income bracket, and self-reported assets? Much weaker signals.
Turns out, how you’ve behaved financially elsewhere tells a bank more than what you say about yourself today. Which is either reassuring or slightly unsettling, depending on your perspective. (So, if I have restructured my loan previously, it will forever show on my scorecard, even when I become a millionaire (which is soon)?)
4. “Expected Loss” is not a vibe. It’s a formula.
A production-grade credit model is defined by the Expected Credit Loss (ECL). This isn’t a simple “yes/no” output but a calculated dollar amount governed by the “Holy Trinity” of risk:
EL = Probability of Default (PD) × Loss Given Default (LGD) × Exposure at Default (EAD)
That’s the number a bank actually cares about, not a binary “will they default or not.”
The most non-obvious part of building this was the Two-Stage LGD model. First, predict whether a loss happens at all. Then, separately, predict how bad it is. Treating those as one question is a common mistake that quietly warps our output.
5. A model that regulators won’t accept is just an expensive hobby
The final stress test wasn’t against my own benchmarks. It was against IFRS 9 and Basel III.
Basel III requires a minimum Gini coefficient of 0.35 for a model to be considered production-ready. This one hit 0.4812.
IFRS 9 adds another layer: once a borrower’s Probability of Default crosses certain thresholds, the bank can’t just provision for 12-month expected loss anymore. It has to provision for lifetime expected loss. That shift costs real capital. The model has to flag it before it happens, not after.
Compliance isn’t a box you tick at the end. It’s an architectural constraint from day one.
Conclusion: The part that actually keeps me thinking
The pipeline produced a portfolio Expected Loss Rate of 0.1317%.
Retail benchmark is 1–3%. So by that measure, the model is performing extremely well.
But here’s the uncomfortable question I keep sitting with: Is the model too conservative?
In trying to eliminate risk, are we quietly locking out borrowers who don’t fit the traditional data profile but would repay just fine? The “thin-file” borrower problem is real, and it’s where credit risk modelling and financial inclusion start to pull in opposite directions.
That tension doesn’t have a clean answer yet. But I think it’s the most important question in this space right now.
Full project linked below if you want to dig into the code and methodology.
And if you’ve built something similar and run into a different set of surprises, I’d genuinely like to hear what they were.
Post: https://www.linkedin.com/feed/update/urn:li:activity:7456945426655776768/
Project Github:https://github.com/ShubhamMalpani97/home-credit-expected-loss/
Website: https://shubhammalpani97.github.io/
#CreditRisk #DataScience #MachineLearning #Fintech #Banking #RiskManagement #IFRS9 #LearningInPublic #QuantitativeFinance #AI