20.04.2026 Bitcoin Near the $74,000 Level: Technical Analysis and Critical Levels
 Oran Market | Kripto Borsa Algo Bitcoin Altcoin3 min read·Just now
--
Bitcoin Market Analysis on April 20, 2026: Technical Outlook and Strategic Levels
Bitcoin (BTC) is trading at $74,576.98 as of April 20, 2026, continuing to show a volatile structure in the markets. Based on current data, both short-term and long-term projections reveal a complex technical picture that investors should carefully evaluate. In this analysis, we examine Bitcoin’s current market structure using data compiled from leading sources such as Investtech, CoinLore, and Altfins.
Trend Analysis on Daily and Weekly Charts
On the daily chart, Bitcoin has not yet formed a clear trend and is mostly moving within a horizontal range. The current technical setup is giving a “sell” signal. Although the price has reclaimed the 50-period EMA (Exponential Moving Average), it is still trading below the 200-period EMA. This situation is typically interpreted as the early stage of a potential trend shift. However, the daily RSI reaching 63.5 suggests that the market is approaching overbought territory, indicating that buyers may pause or a minor correction could occur.
On the weekly timeframe, Bitcoin presents a stronger outlook. Despite two-way price movements within a broader uptrend, the overall technical rating remains “buy”. Although the price has dipped below the 50-week EMA, it continues to hold above the 200-week EMA, confirming that the long-term uptrend remains intact. The weekly RSI stands at 43.8, indicating a neutral zone where momentum is balanced between buyers and sellers.
Key Support and Resistance Levels
Fibonacci retracement levels and previous highs/lows are crucial in understanding Bitcoin’s price movements. According to Altfins data, Bitcoin has recently entered a fresh downtrend starting from $78,400 and is currently attempting to hold above the $73,500 support level.
Resistance Levels:
- The first significant resistance is at $74,750
- The critical threshold lies at $75,500, with the hourly downtrend line at $75,600
- A breakout above these levels could push momentum toward $78,350 and beyond
Support Levels:
- Initial support is located at $74,000
- The most critical support is $73,500
- A breakdown below this level could lead to declines toward $72,500, $71,200, and ultimately the psychological level of $70,000
Momentum Indicators and Volume Analysis
Investtech research indicates that assets within rising trend channels outperform indices by an average of 7.8% annually. For Bitcoin, the volume balance indicator measures investor aggressiveness. A value above 40 suggests stronger buying interest.
Currently, the hourly MACD is gaining momentum in the bearish zone, while the RSI remains below 50, signaling weak buying strength.
Market Psychology and Institutional Behavior
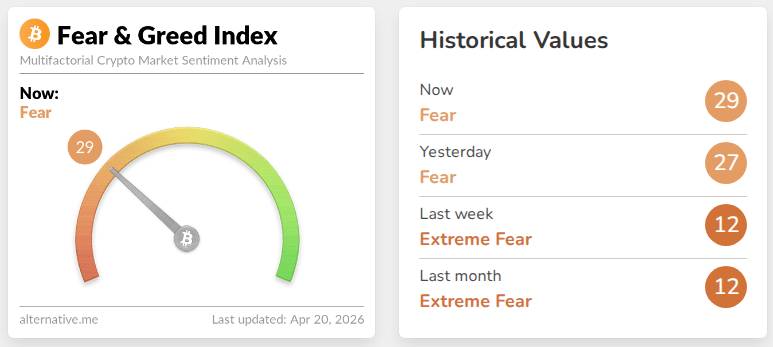
According to data from CryptoRobotics, the Fear and Greed Index currently indicates “Extreme Fear” in the market. However, an interesting contradiction exists: on-chain data shows that long-term investors continue to accumulate quietly.
This divergence highlights a mismatch between market sentiment and actual behavior. Historically, market bottoms tend to form through prolonged sideways movements rather than sharp declines. During such periods, avoiding panic selling and maintaining patience becomes strategically important.
AI-Powered Trading Strategies
As of 2026, AI-powered trading bots have introduced a new dimension to Bitcoin strategies. These systems analyze historical market behavior, adapt to changing conditions, and help reduce risks associated with market corrections.
In particular, historical resistance levels around $50,000 and increasing institutional participation are expected to play a decisive role in Bitcoin’s next cycle.
Conclusion and Evaluation
Bitcoin is currently in a consolidation phase. While short-term bearish pressure persists, weekly and on-chain data indicate that the long-term structure remains intact.
Investors should closely monitor the $73,500 support and $75,600 resistance levels, develop disciplined strategies, and avoid emotional decision-making. In this period of high volatility, relying on technical indicators and utilizing automation tools can significantly improve risk management.
This is not investment advice. Do your own research.
For more details, please visit: en.oranmarket.com